| The SHEWHART Procedure |
Example 13.40 Working with Unequal Subgroup Sample Sizes
[See SHWXR4 in the SAS/QC Sample Library]The following data set (Wire) contains breaking strength measurements recorded in pounds per inch for 25 samples from a metal wire manufacturing process. The subgroup sample sizes vary between 3 and 7.
data Wire;
   input Day size @;
   informat Day date7.;
   format Day date7.;
   do i=1 to size;
      input Breakstrength @@;
      output;
      end;
   drop i size;
   label Breakstrength = 'Breaking Strength';
   datalines;
20JUN94 5 60.6 62.3 62.0 60.4 59.9
21JUN94 5 61.9 62.1 60.6 58.9 65.3
22JUN94 4 57.8 60.5 60.1 57.7
23JUN94 5 56.8 62.5 60.1 62.9 58.9
24JUN94 5 63.0 60.7 57.2 61.0 53.5
25JUN94 7 58.7 60.1 59.7 60.1 59.1 57.3 60.9
26JUN94 5 59.3 61.7 59.1 58.1 60.3
27JUN94 5 61.3 58.5 57.8 61.0 58.6
28JUN94 6 59.5 58.3 57.5 59.4 61.5 59.6
29JUN94 5 61.7 60.7 57.2 56.5 61.5
30JUN94 3 63.9 61.6 60.9
01JUL94 5 58.7 61.4 62.4 57.3 60.5
02JUL94 5 56.8 58.5 55.7 63.0 62.7
03JUL94 5 62.1 60.6 62.1 58.7 58.3
04JUL94 5 59.1 60.4 60.4 59.0 64.1
05JUL94 5 59.9 58.8 59.2 63.0 64.9
06JUL94 6 58.8 62.4 59.4 57.1 61.2 58.6
07JUL94 5 60.3 58.7 60.5 58.6 56.2
08JUL94 5 59.2 59.8 59.7 59.3 60.0
09JUL94 5 62.3 56.0 57.0 61.8 58.8
10JUL94 4 60.5 62.0 61.4 57.7
11JUL94 4 59.3 62.4 60.4 60.0
12JUL94 5 62.4 61.3 60.5 57.7 60.2
13JUL94 5 61.2 55.5 60.2 60.4 62.4
14JUL94 5 59.0 66.1 57.7 58.5 58.9
;
run;
The following statements request  and
and  charts, shown in Output 13.40.1, for the strength measurements:
title 'Mean and Range Charts for Breaking Strengths';
proc shewhart data=Wire;
   xrchart Breakstrength*Day / nohlabel;
run;
and Charts with Varying Subgroup Sample Sizes
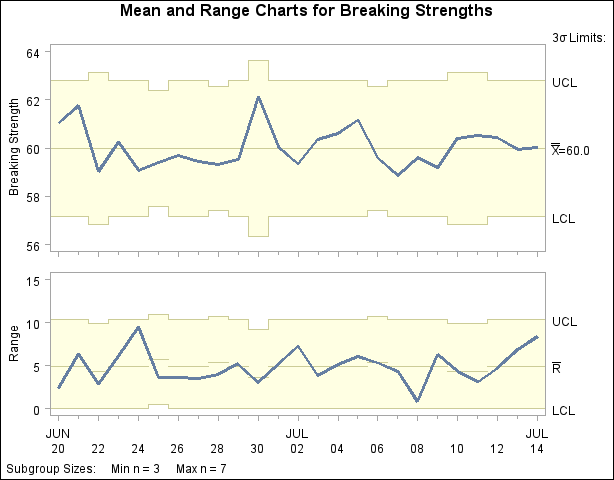
Note that the central line on the chart and the control limits on both charts vary with the subgroup sample size. The sample size legend in the lower-left corner displays the minimum and maximum subgroup sample sizes.
The XRCHART statement provides various options for working with unequal subgroup sample sizes. For example, you can use the LIMITN= option to specify a fixed (nominal) sample size for computing control limits, as illustrated by the following statements:
title 'Mean and Range Charts for Breaking Strengths';
proc shewhart data=Wire;
   xrchart Breakstrength*Day / nohlabel
                               limitn = 5;
run;
The resulting charts are shown in Output 13.40.2.
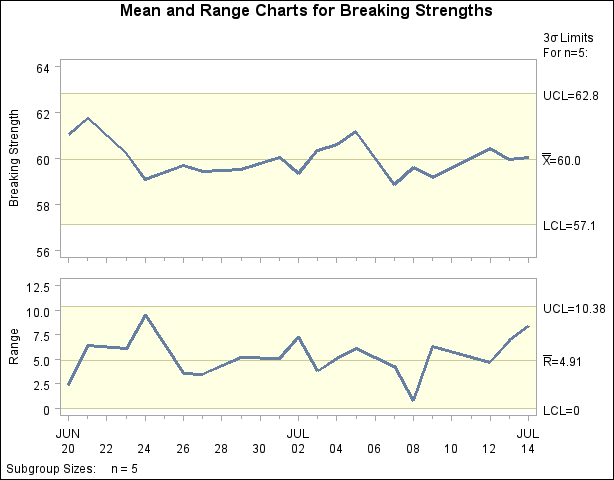
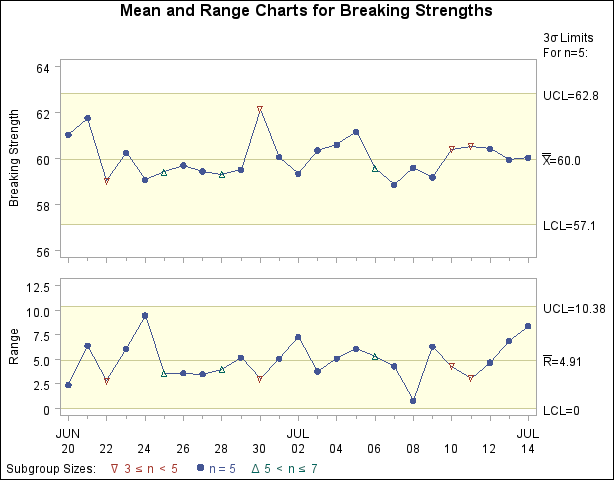
Note that the only points displayed on the chart are those corresponding to subgroups whose sample sizes match the nominal sample size of five. To plot points for all subgroups (regardless of subgroup sample size), you can specify the ALLN option, as follows:
symbol1 v=dot;
title 'Mean and Range Charts for Breaking Strengths';
proc shewhart data=Wire;
   xrchart Breakstrength*Day / nohlabel
                               limitn = 5
                               alln
                               nmarkers;
run;
The charts are shown in Output 13.40.3. The NMARKERS option requests special symbols to identify points for which the subgroup sample size differs from the nominal sample size.
You can use the SMETHOD= option to determine how the process standard deviation  is to be estimated when the subgroup sample sizes vary. The default method computes
  as an unweighted average of subgroup estimates of . Specifying SMETHOD=MVLUE requests an estimate that assigns greater weight to estimates of from subgroups with larger sample sizes. For more information, see Methods for Estimating the Standard Deviation.
The following statements apply both methods:
proc shewhart data=Wire;
   xrchart Breakstrength*Day / outlimits = Wlim1
                               outindex  = 'Default'
                               nochart;
   xrchart Breakstrength*Day / smethod   = mvlue
                               outlimits = Wlim2
                               outindex  = 'MVLUE'
                               nochart;
run;

data Wlimits;
   set Wlim1 Wlim2;
run;
The data set Wlimits is listed in Output 13.40.4.
The variables in an OUTLIMITS= data set whose values vary with subgroup sample size are assigned the special missing value V. Consequently, the control limit variables (_LCLX_, _UCLX_, _LCLR_, and _UCLR_), as well as the variables _R_ and _LIMITN_, have this value.
Copyright © SAS Institute, Inc. All Rights Reserved.