| The SHEWHART Procedure |
Creating u Charts from Defect Count Data
[See SHWUCHR in the SAS/QC Sample Library]A textile company uses a  chart to monitor the number of defects per square meter of fabric. The fabric is spooled onto rolls as it is inspected for defects. Each piece of fabric is one meter wide and 30 meters in length. The following statements create a SAS data set named Fabric, which contains the defect counts for 20 rolls:
data Fabric;
   input Roll Defects @@;
datalines;
 1 12    2 11    3  9    4 15
 5  7    6  6    7  5    8 10
 9  8   10  8   11 14   12  5
13  9   14 13   15  7   16  5
17  8   18 11   19  7   20 12
;
run;
A partial listing of Fabric is shown in Figure 13.30.3.
There is a single observation per roll. The variable Roll identifies the subgroup sample and is referred to as the subgroup-variable. The variable Defects contains the number of nonconformities (defect count) for each subgroup sample and is referred to as the process variable (or process for short).
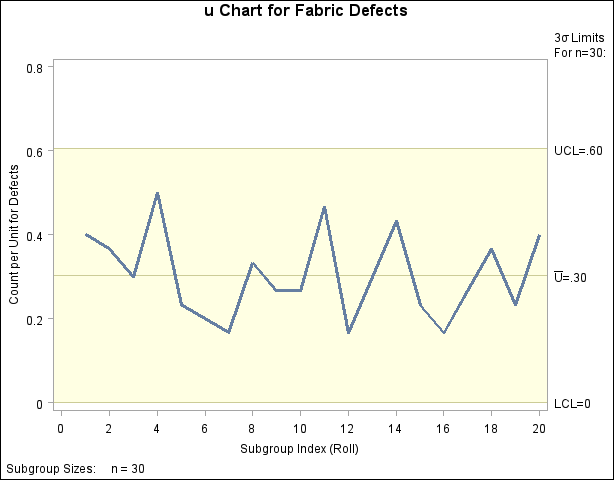
The following statements create the chart shown in Figure 13.30.4:
title 'u Chart for Fabric Defects';
proc shewhart data=Fabric;
   uchart Defects*Roll / subgroupn = 30;
run;
This example illustrates the basic form of the UCHART statement. After the keyword UCHART, you specify the process to analyze (in this case, Defects), followed by an asterisk and the subgroup-variable (Roll).
The SUBGROUPN= option specifies the number of inspection units in each subgroup sample and is required if the input data set is a DATA= data set. In this example, each square meter of fabric is an inspection unit, and each roll is a subgroup sample. The number of inspection units per subgroup can be thought of as the subgroup sample size.
You can use the SUBGROUPN= option to specify one of the following:
a constant subgroup sample size (as in this example)
an input variable name whose values contain the subgroup sample sizes (for an example, see Saving Nonconformities per Unit)
Options such as SUBGROUPN= are specified after the slash (/) in the UCHART statement. A complete list of options is presented in the section Syntax.
Chart Example (Traditional Graphics)
The input data set is specified with the DATA= option in the PROC SHEWHART statement.
Each point on the chart represents the number of nonconformities per inspection unit for a particular subgroup. For instance, the value plotted for the first subgroup is  (since there are 12 defects on the first roll and this roll contains 30 square meters of fabric). By default, the control limits shown are 3
 limits estimated from the data; the formulas for the limits are given in Control Limits. Since none of the points exceed the
  limits, the chart indicates that the fabric manufacturing process is in statistical control.
See Constructing Charts for Nonconformities per Unit (u Charts) for details concerning charts. For more details on reading defect count data, see DATA= Data Set.
Copyright © SAS Institute, Inc. All Rights Reserved.