| The CAPABILITY Procedure |
Summary of Theoretical Distributions
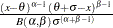
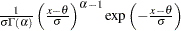
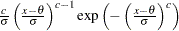
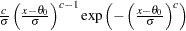
You can use the PROBPLOT statement to request probability plots based on the theoretical distributions summarized in the following table:
Parameters |
|||||
|---|---|---|---|---|---|
Distribution |
Density Function |
Range |
Location |
Scale |
Shape |
Beta |
|
|
|
|
|
Exponential |
|
|
|
|
|
Gamma |
|
|
|
|
|
Lognormal |
|
|
|
|
|
(3-parameter) |
|||||
Normal |
|
all |
|
|
|
Weibull |
|
|
|
|
|
(3-parameter) |
|||||
Weibull |
|
|
|
|
|
(2-parameter) |
(known) |
||||


 ,
, 


You can request these distributions with the BETA, EXPONENTIAL, GAMMA, LOGNORMAL, NORMAL, WEIBULL, and WEIBULL2 options, respectively. If you do not specify a distribution option, a normal probability plot is created.
Shape Parameters
Some of the distribution options in the PROBPLOT statement require you to specify one or two shape parameters in parentheses after the distribution keyword. These are summarized in Table 5.63.
Distribution Keyword |
Mandatory Shape Parameter Option |
Range |
|---|---|---|
BETA |
ALPHA= |
|
EXPONENTIAL |
None |
|
GAMMA |
ALPHA= |
|
LOGNORMAL |
SIGMA= |
|
NORMAL |
None |
|
WEIBULL |
C= |
|
WEIBULL2 |
None |
 ,
, 


You can visually estimate the value of a shape parameter by specifying a list of values for the shape parameter option. The PROBPLOT statement produces a separate plot for each value. You can then use the value of the shape parameter producing the most nearly linear point pattern. Alternatively, you can request that the plot be created using an estimated shape parameter. For an example, see Creating Lognormal Probability Plots.
Location and Scale Parameters
If you specify the location and scale parameters for a distribution (or if you request estimates for these parameters), a diagonal distribution reference line is displayed on the plot. (An exception is the two-parameter Weibull distribution, for which a line is displayed when you specify or estimate the scale and shape parameters.) Agreement between this line and the point pattern indicates that the distribution with these parameters is a good fit. For illustrations, see Example 5.19 and Example 5.20.
The following table shows how the specified parameters determine the intercept1 and slope of the line:
Parameters |
Linear Pattern |
||||
|---|---|---|---|---|---|
Distribution |
Location |
Scale |
Shape |
Intercept |
Slope |
Beta |
|
|
|
|
|
Exponential |
|
|
|
|
|
Gamma |
|
|
|
|
|
Lognormal |
|
|
|
|
|
Normal |
|
|
|
|
|
Weibull (3-parameter) |
|
|
|
|
|
Weibull (2-parameter) |
|
|
|
|
|


For the LOGNORMAL and WEIBULL2 options, you can specify the slope directly with the SLOPE= option. That is, for the LOGNORMAL option, specifying THETA= and SLOPE=
 displays the same line as specifying THETA= and ZETA=
 . For the WEIBULL2 option, specifying SIGMA=
 and SLOPE=
 displays the same line as specifying SIGMA= and C=
 .
.
Footnotes
Copyright © SAS Institute, Inc. All Rights Reserved.