| The CAPABILITY Procedure |
Creating a One-Way Comparative Histogram
[See CAPCMH1 in the SAS/QC Sample Library]The effective channel length (in microns) is measured for 1225 field effect transistors. The channel lengths are saved as values of the variable Length in a SAS data set named Channel:
data Channel;
   length Lot $ 16;
   input Length @@;
   select;
        when (_n_ <= 425) Lot='Lot 1';
        when (_n_ >= 926) Lot='Lot 3';
        otherwise Lot='Lot 2';
     end;
   datalines;
0.91 1.01 0.95 1.13 1.12 0.86 0.96 1.17 1.36 1.10
0.98 1.27 1.13 0.92 1.15 1.26 1.14 0.88 1.03 1.00
0.98 0.94 1.09 0.92 1.10 0.95 1.05 1.05 1.11 1.15
1.11 0.98 0.78 1.09 0.94 1.05 0.89 1.16 0.88 1.19

   ... more lines ...

1.80 2.35 2.23 1.96 2.16 2.08 2.06 2.03 2.18 1.83
2.13 2.05 1.90 2.07 2.15 1.96 2.15 1.89 2.15 2.04
1.95 1.93 2.22 1.74 1.91
;
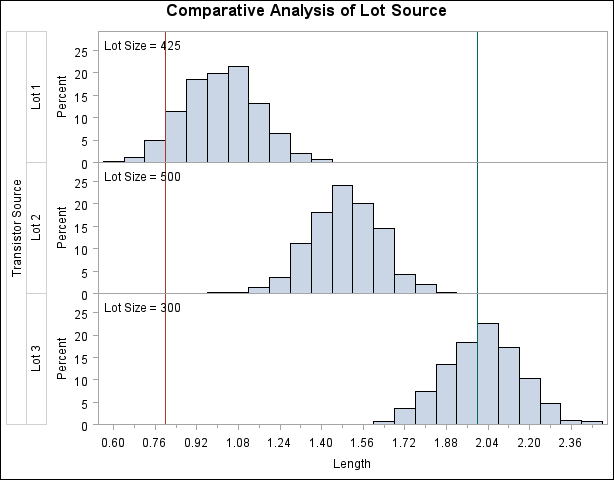
The data set Channel is also used in Example 5.12, where a kernel density estimate is superimposed on the histogram of channel lengths. The display in Output 5.12.1 reveals that there are three distinct peaks in the process distribution. To investigate whether these peaks (modes) in the histogram are related to the lot source, you can create a comparative histogram that uses Lot as a classification variable. The following statements create the comparative histogram shown in Figure 5.5.2:
title "Comparative Analysis of Lot Source";
proc capability data=Channel noprint;
   specs lsl = 0.8 usl = 2.0;
   comphist Length / class      = Lot
                     nrows      = 3
                     nlegend    = 'Lot Size'
                     nlegendpos = nw;
   label Lot = 'Transistor Source';
run;
The COMPHISTOGRAM statement requests a comparative histogram for the process variable Length. The CLASS= option requests a component histogram for each level (distinct value) of the classification variable Lot. The option NROWS=3 stacks the histograms three to a page. The NLEGEND= option adds a sample size legend to each component histogram, and the option NLEGENDPOS=NW positions each legend in the northwest corner. The SPEC statement provides the specification limits displayed as vertical reference lines. See the section Dictionary of Options for descriptions of these options, and see the section Syntax for the SPEC Statement for details of the SPEC statement.
Copyright © SAS Institute, Inc. All Rights Reserved.