CHART Procedure

Example 5: Producing a Horizontal Bar Chart for a Subset of the Data
| Features: |
|
| Other features: |
WHERE= data set option |
| Data set: | PIESALES |
Program
proc chart data=piesales(where=(year=2005));
hbar bakery / group=flavor
sumvar=pies_sold;
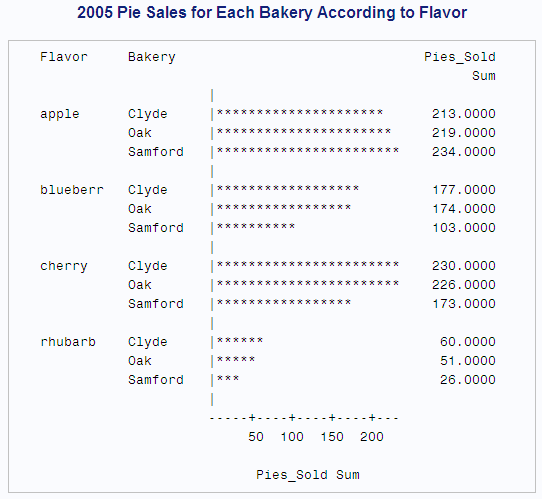
   title '2005 Pie Sales for Each Bakery According to Flavor';
run;
Program Description
Specify the variable value limitation for the horizontal
bar chart. WHERE= limits the chart to
only the 2005 sales totals.
Create a side-by-side horizontal bar chart. The HBAR statement produces a side-by-side horizontal
bar chart to compare sales across values of Flavor, specified by GROUP=.
Each Flavor group contains a bar for each Bakery value.