CHART Procedure

Example 3: Subdividing the Bars into Categories
| Features: |
|
Program
data piesales;
   input Bakery $ Flavor $ Year Pies_Sold;
   datalines;
Samford  apple      2005  234
Samford  apple      2006  288
Samford  blueberry  2005  103
Samford  blueberry  2006  143
Samford  cherry     2005  173
Samford  cherry     2006  195
Samford  rhubarb    2005   26
Samford  rhubarb    2006   28
Oak      apple      2005  219
Oak      apple      2006  371
Oak      blueberry  2005  174
Oak      blueberry  2006  206
Oak      cherry     2005  226
Oak      cherry     2006  311
Oak      rhubarb    2005   51
Oak      rhubarb    2006   56
Clyde    apple      2005  213
Clyde    apple      2006  415
Clyde    blueberry  2005  177
Clyde    blueberry  2006  201
Clyde    cherry     2005  230
Clyde    cherry     2006  328
Clyde    rhubarb    2005   60
Clyde    rhubarb    2006   59
;
proc chart data=piesales;
   vbar flavor / subgroup=bakery
sumvar=pies_sold;
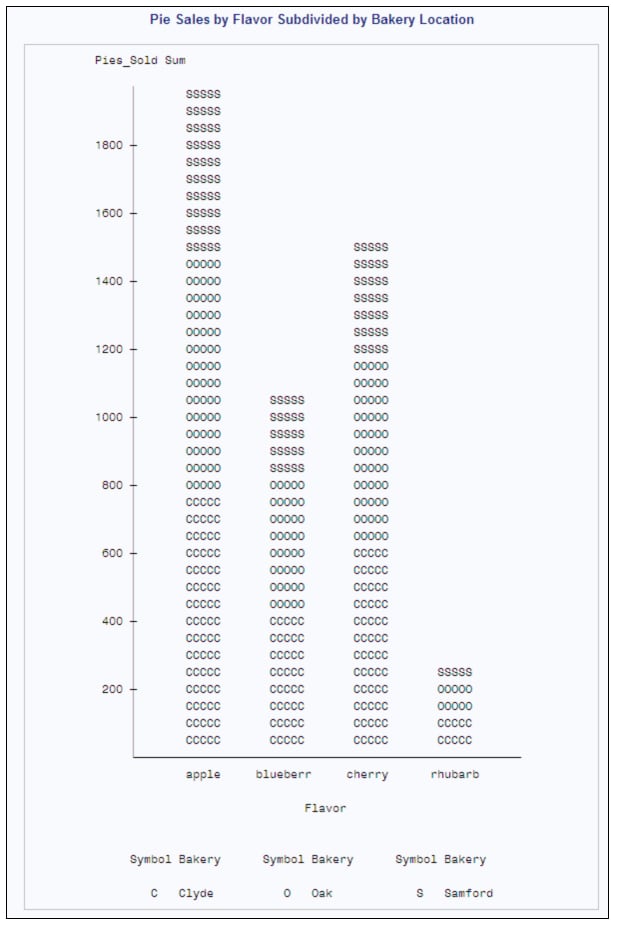
   title 'Pie Sales by Flavor Subdivided by Bakery Location';
run;
Program Description
Create the PIESALES data set. PIESALES
contains the number of each flavor of pie that is sold for two years
at three bakeries that are owned by the same company. One bakery is
on Samford Avenue, one on Oak Street, and one on Clyde Drive.
data piesales;
   input Bakery $ Flavor $ Year Pies_Sold;
   datalines;
Samford  apple      2005  234
Samford  apple      2006  288
Samford  blueberry  2005  103
Samford  blueberry  2006  143
Samford  cherry     2005  173
Samford  cherry     2006  195
Samford  rhubarb    2005   26
Samford  rhubarb    2006   28
Oak      apple      2005  219
Oak      apple      2006  371
Oak      blueberry  2005  174
Oak      blueberry  2006  206
Oak      cherry     2005  226
Oak      cherry     2006  311
Oak      rhubarb    2005   51
Oak      rhubarb    2006   56
Clyde    apple      2005  213
Clyde    apple      2006  415
Clyde    blueberry  2005  177
Clyde    blueberry  2006  201
Clyde    cherry     2005  230
Clyde    cherry     2006  328
Clyde    rhubarb    2005   60
Clyde    rhubarb    2006   59
;
Create a vertical bar chart with the bars that are subdivided
into categories. The VBAR statement
produces a vertical bar chart with one bar for each pie flavor. SUBGROUP=
divides each bar into sales for each bakery.
Output: HTML
In the following output,
the bar that represents the sales of apple pies, for example, shows
1,940 total pies across both years and all three bakeries. The symbol
for the Samford Avenue bakery represents the 522 pies at the top.
The symbol for the Oak Street bakery represents the 690 pies in the
middle. The symbol for the Clyde Drive bakery represents the 728 pies
at the bottom of the bar for apple pies. By default, the labels along
the horizontal axis are truncated to eight characters.