Example 8.16 Gantt Charts by Persons
Now suppose that you want to obtain individual Gantt charts for two people (Thomas and William) working on the widget manufacturing project. The data set WIDGBYGP, displayed in Output 8.16.1, contains two new variables, THOMAS and WILLIAM. Each variable has a value '1' for activities in which the person is involved and a missing value otherwise. Thus, a value of '1' for the variable THOMAS in observation number 2 indicates that Thomas is working on the activity 'Drawings.'
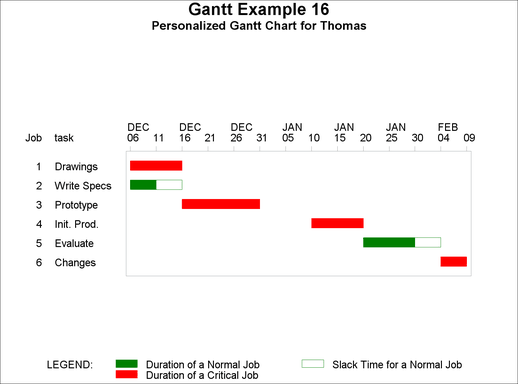
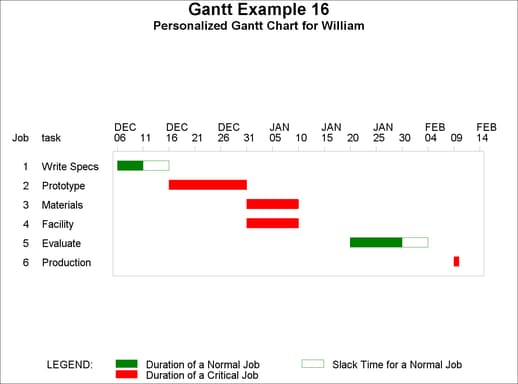
PROC CPM is used to schedule the project to start on December 1, 2003. A data set named PERSONS is created containing one observation per activity per person working on that activity and a new variable named PERSON containing the name of the person to which the observation pertains. For example, this new data set contains two observations for the activity 'Write Specs,' one with PERSON='Thomas' and the other with PERSON='William,' and no observation for the activity 'Approve Plan.' This data set is sorted by PERSON and E_START, and displayed in Output 8.16.2. PROC GANTT is next invoked with a BY statement to obtain individual charts for each person. The resulting Gantt charts are shown in Output 8.16.3. The BY-LINE is suppressed by specifying the NOBYLINE option in an OPTIONS statement and the name of the person corresponding to the chart is displayed in the subtitle by using the #BYVAL substitution in the TITLE2 statement.
Output 8.16.1
Data Set WIDGBYGP
| Approve Plan |
5 |
1 |
2 |
. |
. |
| Drawings |
10 |
2 |
3 |
1 |
. |
| Study Market |
5 |
2 |
4 |
. |
. |
| Write Specs |
5 |
2 |
3 |
1 |
1 |
| Prototype |
15 |
3 |
5 |
1 |
1 |
| Mkt. Strat. |
10 |
4 |
6 |
. |
. |
| Materials |
10 |
5 |
7 |
. |
1 |
| Facility |
10 |
5 |
7 |
. |
1 |
| Init. Prod. |
10 |
7 |
8 |
1 |
. |
| Evaluate |
10 |
8 |
9 |
1 |
1 |
| Test Market |
15 |
6 |
9 |
. |
. |
| Changes |
5 |
9 |
10 |
1 |
. |
| Production |
0 |
10 |
11 |
. |
1 |
| Marketing |
0 |
6 |
12 |
. |
. |
| Dummy |
0 |
8 |
6 |
. |
. |
title h=1.75 'Gantt Example 16';

proc cpm data=widgbyp date='1dec03'd;
   tailnode tail;
   duration days;
   headnode head;
   id task thomas william;
run;
data persons;
   set _last_;
   if william^=. then do;
      person='William';
      output;
      end;
   if thomas^=. then do;
      person='Thomas';
      output;
      end;
   drop thomas william;
run;
proc sort data=persons;
   by person e_start;
run;

title2 'Data PERSONS';
proc print data=persons;
   run;
/* suppress byline */
options nobyline;

goptions hpos=120 vpos=40 htext=1.1;

title2 h=1.25 'Personalized Gantt Chart for #BYVAL(person)';
proc gantt data=persons;
   chart / pcompress;
   by person;
   id task;
   run;
Output 8.16.2
Data Set PERSONS
| 2 |
3 |
10 |
Drawings |
06DEC03 |
15DEC03 |
06DEC03 |
15DEC03 |
0 |
0 |
Thomas |
| 2 |
3 |
5 |
Write Specs |
06DEC03 |
10DEC03 |
11DEC03 |
15DEC03 |
5 |
5 |
Thomas |
| 3 |
5 |
15 |
Prototype |
16DEC03 |
30DEC03 |
16DEC03 |
30DEC03 |
0 |
0 |
Thomas |
| 7 |
8 |
10 |
Init. Prod. |
10JAN04 |
19JAN04 |
10JAN04 |
19JAN04 |
0 |
0 |
Thomas |
| 8 |
9 |
10 |
Evaluate |
20JAN04 |
29JAN04 |
25JAN04 |
03FEB04 |
5 |
5 |
Thomas |
| 9 |
10 |
5 |
Changes |
04FEB04 |
08FEB04 |
04FEB04 |
08FEB04 |
0 |
0 |
Thomas |
| 2 |
3 |
5 |
Write Specs |
06DEC03 |
10DEC03 |
11DEC03 |
15DEC03 |
5 |
5 |
William |
| 3 |
5 |
15 |
Prototype |
16DEC03 |
30DEC03 |
16DEC03 |
30DEC03 |
0 |
0 |
William |
| 5 |
7 |
10 |
Materials |
31DEC03 |
09JAN04 |
31DEC03 |
09JAN04 |
0 |
0 |
William |
| 5 |
7 |
10 |
Facility |
31DEC03 |
09JAN04 |
31DEC03 |
09JAN04 |
0 |
0 |
William |
| 8 |
9 |
10 |
Evaluate |
20JAN04 |
29JAN04 |
25JAN04 |
03FEB04 |
5 |
5 |
William |
| 10 |
11 |
0 |
Production |
09FEB04 |
09FEB04 |
09FEB04 |
09FEB04 |
0 |
0 |
William |
Output 8.16.3
Gantt Charts by Person
Copyright © SAS Institute Inc. All rights reserved.