| The GANTT Procedure |
Example 8.27 Using the CHARTWIDTH= Option
This example illustrates the use of the CHARTWIDTH= option to create Gantt charts that are consistent in appearance. The data set used in this example is the SAVE data set created in Example 8.6.
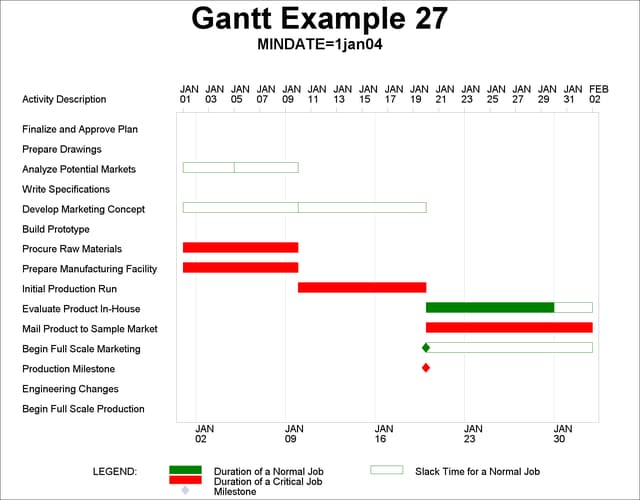
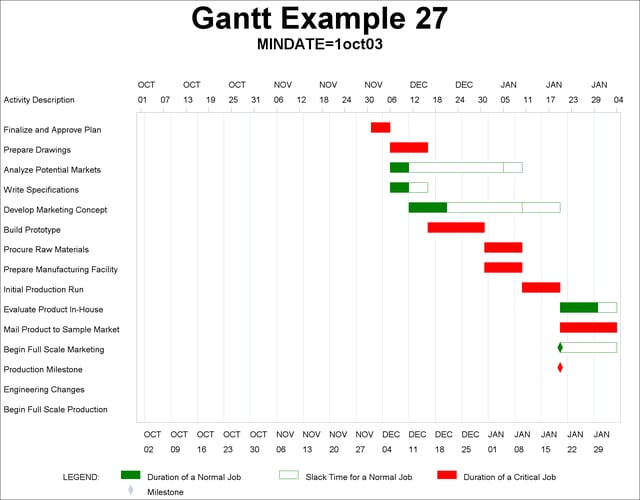
Gantt charts are first produced using different values of the MINDATE= option, and without specifying the CHARTWIDTH= option. Output 8.27.1 shows a Gantt chart using MINDATE='1jan04', and Output 8.27.2 shows a Gantt chart using MINDATE='1oct03'. Notice that the chart in Output 8.27.2 has a much larger chart area than the chart in Output 8.27.1, and the 'Activity Description' column is compressed and rather difficult to read.
* plot the schedule with MINDATE=1jan04;
title 'Gantt Example 27';
title2 'MINDATE=1jan04';
proc gantt data=save;
   chart / mindate='1jan04'd maxdate='1feb04'd
           dur=days nojobnum compress fill
           ref='2jan04'd to '2feb04'd by week
           reflabel;
   id descrpt;
   run;
* plot the schedule with MINDATE=1oct03;
title 'Gantt Example 27';
title2 'MINDATE=1oct03';
proc gantt data=save;
   chart / mindate='1oct03'd maxdate='1feb04'd
           dur=days nojobnum compress fill
           ref='2oct03'd to '2feb04'd by week
           reflabel height=1.5;
   id descrpt;
   run;


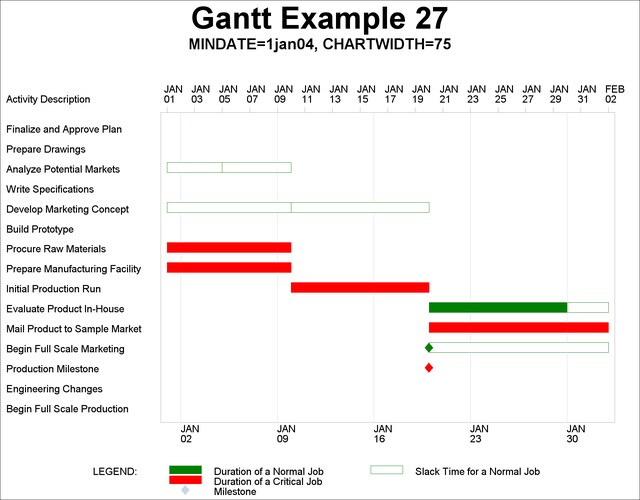
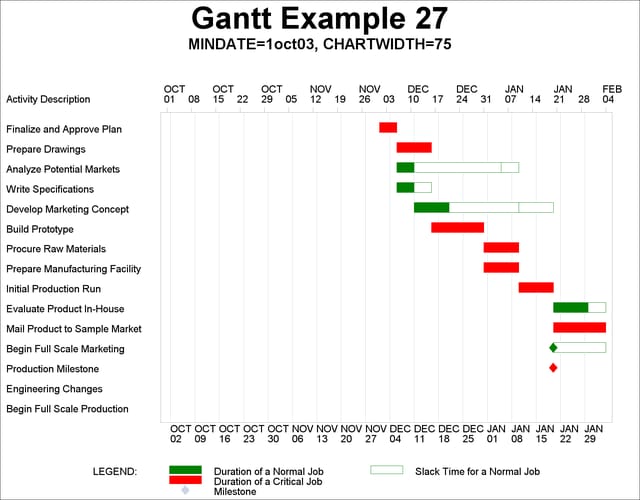
The same charts are now plotted with the CHARTWIDTH= option. The specification CHARTWIDTH=75 indicates that the chart is rescaled so the axis area is 75% of the chart width and the text area is 25% of the chart width. Therefore, specifying CHARTWIDTH=75 for both charts gives the two charts a consistent appearance. The output is shown in Output 8.27.3 and Output 8.27.4.
* plot the schedule with MINDATE=1jan04 and CHARTWIDTH=75;
title 'Gantt Example 27';
title2 'MINDATE=1jan04, CHARTWIDTH=75';
proc gantt data=save;
   chart / mindate='1jan04'd maxdate='1feb04'd
           dur=days nojobnum compress fill
           ref='2jan04'd to '2feb04'd by week
           reflabel chartwidth=75;
   id descrpt;
   run;
* plot the schedule with MINDATE=1oct03 and CHARTWIDTH=75;
title 'Gantt Example 27';
title2 'MINDATE=1oct03, CHARTWIDTH=75';
proc gantt data=save;
   chart / mindate='1oct03'd maxdate='1feb04'd
           dur=days nojobnum compress fill
           ref='2oct03'd to '2feb04'd by week
           reflabel chartwidth=75;
   id descrpt;
   run;


Copyright © SAS Institute, Inc. All Rights Reserved.