| The GANTT Procedure |
Example 8.26 Web-Enabled Gantt Charts
This example illustrates the process of "Web-enabling" your Gantt charts. This feature enables you to associate a URL with each activity on a Gantt chart. By using this feature together with SAS/IntrNet software, you can develop some very powerful Project Management applications. SAS/IntrNet software provides you with the capability to perform data set queries and execute SAS applications in real time and view the results in HTML format using a Web browser.
This example takes advantage of the Output Delivery System (ODS) HTML statement to create a very simple "drill-down" Gantt application beginning from a summary Gantt chart of the "top level" projects in Example 8.23. The objective is to display a detailed Gantt chart of the activities in a subproject when you click on the subproject bar.
In order to be able to click on an activity and invoke an action, you need to add variables to the schedule data set that associate a URL with each of the activities that you want linked. The following code adds the WEBVAR and WEBVAR2 variables to the LANOUT data set in Example 8.23 to create the LANWEB data set. The WEBVAR variable uses the ALT= portion to identify information about an activity’s schedule that is to be displayed when the mouse hovers over the schedule bar. In addition, it uses the HREF= portion to associate the URL with the linked activity. The WEBVAR2 variable uses only the ALT= portion, so information in the detailed Gantt chart can still be displayed by hovering over the schedule bars.
The LANWEB data set is then sorted by the WBS_CODE variable.
data lanweb;
   set lanout;
   length webvar $500;
   length webvar2 $500;

   /* WEBVAR is for the top-level summary chart */
   webvar='alt='|| quote(
     'Activity: '||trim(left(act))||'0D'x||
     '-----------------------'||'0D'x||
     'Early Start: '||put(e_start,  datetime.)||'0D'x||
     'Early Finish:'||put(e_finish, datetime.)||'0D'x||
     'Late Start:  '||put(l_start,  datetime.)||'0D'x||
     'Late Finish: '||put(l_finish, datetime.) )||
     ' HREF=#'||trim(wbs_code)  /* link to the anchors */
     ;

   /* WEBVAR2 is for the detailed charts */
   webvar2='alt='|| quote(
     'Activity: '||trim(left(act))||'0D'x||
     '-----------------------'||'0D'x||
     'Early Start: '||put(e_start,  datetime.)||'0D'x||
     'Early Finish:'||put(e_finish, datetime.)||'0D'x||
     'Late Start:  '||put(l_start,  datetime.)||'0D'x||
     'Late Finish: '||put(l_finish, datetime.) )
     ;
   run;
proc sort data=lanweb;
   by wbs_code;
   run;
Before creating the charts, you need to specify that the GIF driver be used to create graphics output. ODS HTML output always creates a "body" file, which is a single HTML document containing the output from one or more procedures and is specified using the FILE= option in the ODS HTML statement.
goptions reset=all device=gif;

ods html file="Gantt_Sum.html";
For example, when you click on any of the schedule bars for an activity with WBS_CODE='0.2', you link to an anchor labeled '0.2' in the body file Gantt_Sum.html.
You are now ready to create the summary Gantt chart. You identify the WEBVAR variable to the GANTT procedure using the HTML= option in the CHART statement and invoke the procedure using a WHERE clause to produce a Gantt chart of the top-level activities.
/* Create the Summary Gantt Chart with Drill Down Action */
pattern1  c=green  v=s;         /* Non-critical duration */
pattern2  c=green  v=e;         /* Slack duration        */
pattern3  c=red    v=s;         /* Critical duration     */
goptions cback=white;

title1 'Gantt Example 26';
title2 'Project Summary Gantt Chart';

proc gantt data=lanweb;
   id act wbs_code;
   where proj_lev=1;
   label act='SUBPROJECT' wbs_code='WBS CODE';
   chart / pcompress nojobnum
           duration=days
           mininterval=week scale=2.5
           mindate='30oct03'd maxdate='29feb04'd
           ref='30oct03:00:00'dt to '01mar04:00:00'dt by dtmonth
           reflabel
           html=webvar
           act=act succ=succ cprec=black;
   run;
The graph that is displayed when you click on one of the subprojects is determined by the name of the anchor that has been defined for the subproject. Before creating these graphs, you need to define the anchor name in an ODS HTML statement using the ANCHOR= option to add the anchor to the HTML body file. Since you have to create a chart for each subproject, you can automate this process by using a SAS macro.
/* Define the macro to generate the detail charts */
%macro gandet(wbs);

goptions device=gif;
ods html anchor=&wbs;

title1 'Gantt Example 26';
title2 "Detail Gantt Chart for WBS="&wbs;

proc gantt data=lanweb;
   id act wbs_code;
   where index(wbs_code,&wbs)=1;
   label act='SUBPROJECT' wbs_code='WBS CODE';
   chart / pcompress nojobnum
           duration=days
           mininterval=week scale=2.5
           mindate='30oct03'd maxdate='29feb04'd
           ref='30oct03:00:00'dt to '01mar04:00:00'dt by dtmonth
           reflabel html=webvar2
           act=act succ=succ cprec=black;
   run;
%mend;

/* Generate each of the detail Gantt Charts */
%gandet('0.1');
%gandet('0.2');
%gandet('0.3');
%gandet('0.4');
%gandet('0.5');
%gandet('0.6');
Finally, use the ODS HTML CLOSE statement to close the body file and stop generating HTML output.
ods html close;
After you have closed the body file, you can display it in a browser window, as shown in Output 8.26.1, to view the output generated by this example.
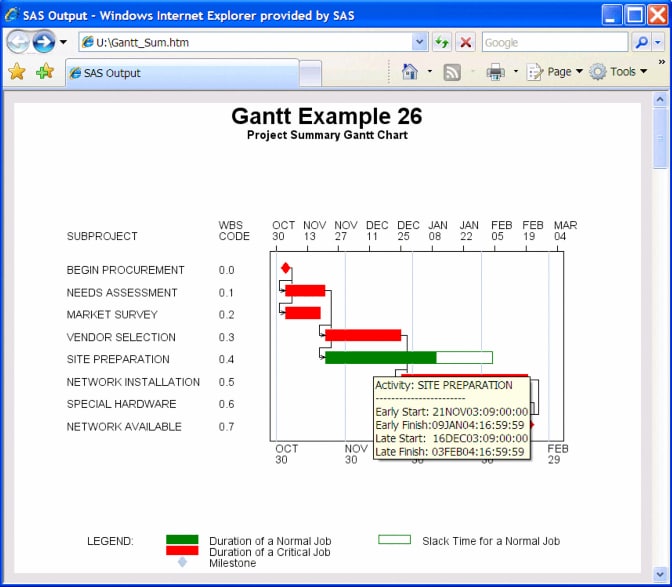
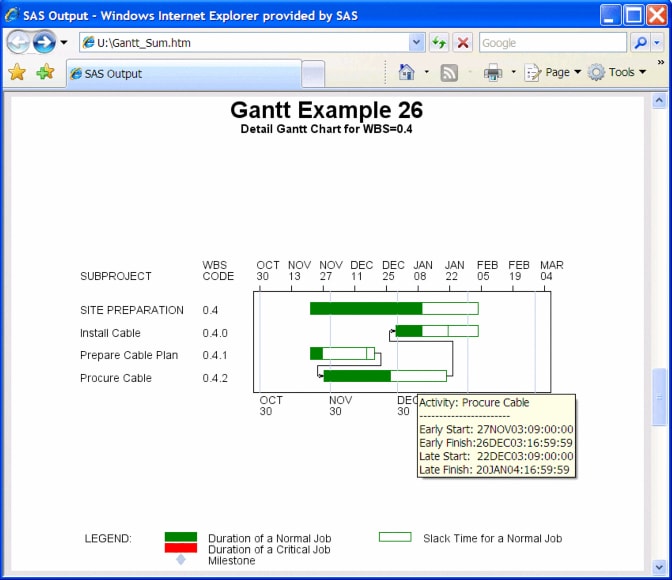
Notice the hand-shaped cursor on the SITE PREPARATION bar, which indicates that this bar is a "hot" link. The alternate text box displays the early and late schedules of the SITE PREPARATION activity. The status bar of the browser also shows that clicking the SITE PREPARATION bar will take you to the location identified by "Gantt_Sum.html#0.4," which is shown in Output 8.26.2.
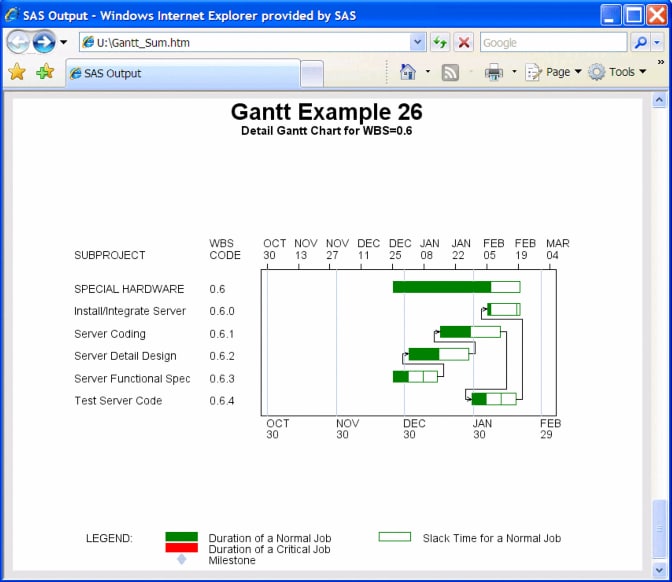
Similarly, the detail Gantt chart that is displayed when you click on the SPECIAL HARDWARE summary bar is shown in Output 8.26.3.
Copyright © SAS Institute, Inc. All Rights Reserved.