| The GANTT Procedure |
Example 8.28 Using the TIMEAXISFORMAT= Option
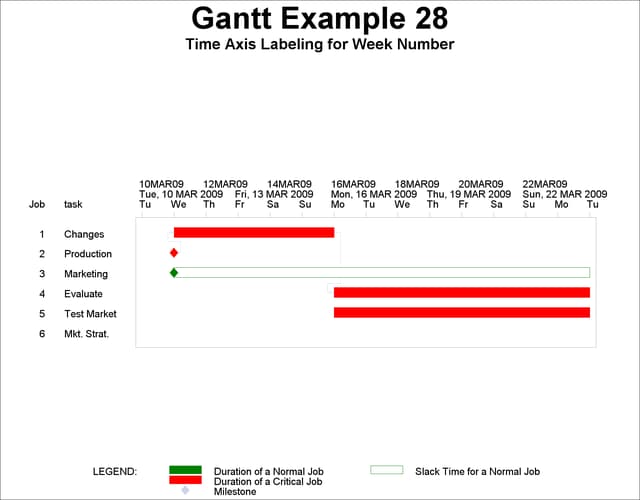
The following statements illustrate the use of the TIMEAXISFORMAT= option to specify formats for up to three rows of time-axis labels. The Activity data set for PROC CPM is the WIDGETA data set from Example 2.2, which defines the widget manufacturing project in AOA format.
* schedule the project subject to holidays and weekends;

proc cpm data=widgeta out=savehp
         date='11mar09'd;
   successor tail;
   activity head;
   duration days;
   id task dept descrpt;
run;

* sort the schedule by the early start date ;

proc sort;
   by e_start;
run;

/* define a date format that includes the day of the week */
proc format;
    picture  dowdate (default=16) low-high = '%a, %d %b %Y'
        (datatype=date fill='0');
run;
* plot the logic Gantt chart using AOA representation;
proc gantt data=savehp (obs=6);
   title2 'Time Axis Labeling for Week Number';
   chart / compress
           activity=head
           successor=tail
           mininterval=day
           increment=1
           dur=days
           maxdate='24MAR09'd
           taformat=(date7., dowdate., downame2.)
           ;
   id task;
run;
The resulting Gantt chart, displayed in Output 8.28.1, contains one time-axis row for each format specified.
Output 8.28.1
Using the TIMEAXISFORMAT= Option
Copyright © SAS Institute, Inc. All Rights Reserved.