| The Projman Application |
Gantt Chart Options Window
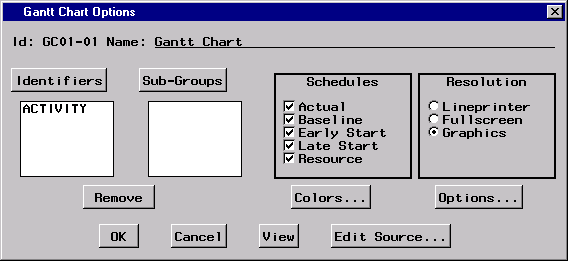
This window provides access to the settings and options available for Gantt chart reports. By changing values in this window, you can create and customize Gantt chart reports to meet your specific needs. Note that some options may be unavailable if the active project does not contain the appropriate data. Also, if data unique to a specific project are required by a report, that report may fail when generated for a different project.
Note that reports can be generated and viewed to verify the results before any changes are saved. Access to the source code is also provided.
For a description of standard report options, see the section "Standard Options".
|
Schedules
The Schedules options provide the capability to control which project schedules are to be drawn on the Gantt chart. You can choose one or more of the following schedules: actual, baseline, early start, late start, and resource-constrained. At least one schedule should be selected. If the active project does not have the indicated schedules, the extra specifications are ignored when the report is generated.Resolution
This option is used to specify the resolution of the Gantt chart report. The report can be produced with either lineprinter, fullscreen, or graphics-quality resolution.Colors
By clicking this button, you can access a window containing color options for the Gantt chart report. These options are used to control the colors of different portions of the Gantt chart output. Note that these options have no effect unless the Resolution option is set to produce a graphics-quality report.Options
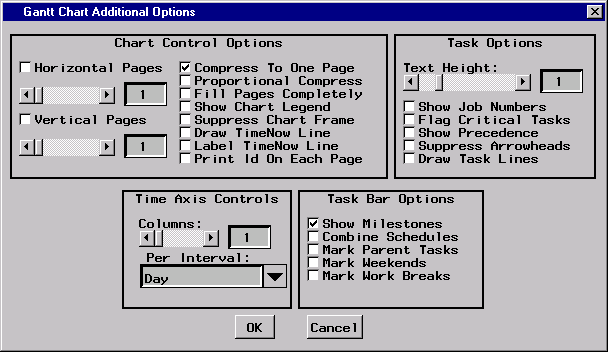
By clicking this button, you can access a window containing additional options for the Gantt chart report.
|
Chart Control Options
Task Options
Time Axis Controls
Task Bar Options
Color Options
Copyright © 2008 by SAS Institute Inc., Cary, NC, USA. All rights reserved.