Viewing Reports in a Gallery
About Viewing Reports in a Gallery
How to View Reports in a Gallery
-
(Optional) Click the Filters icon
( at the top of the Browse pane to view the Filters pane. Select the filters that you want to use to subset the reports in the gallery for viewing. For more information about using the Filters pane, see Filtering Reports in an Existing Gallery. )
)
Filtering Reports in an Existing Gallery
Understanding the Filters Pane
The Filters pane enables
you to subset the view of reports in a gallery by one or more criteria.
This process reduces the number of reports that are shown in the gallery
so that you can limit the display to those specific reports that meet
your filter criteria.
The filters in the Filters
pane are organized into filter groups. You can click the arrow ( )
) next to a filter group to see
each variable that it includes. Then, click the check box for a filter
variable to select it. When a variable is selected, a check ( )
) appears in the corresponding
check box.
 )
) )
)Tip
If you select at least one
variable within a filter group, then the check box for the filter
group appears with a black square  )
) )
)How Filters Work in the Filters Pane
The filter variables
in the Filters pane are criteria that restrict the gallery reports
that are displayed in the Gallery pane. When you select a filter variable
within a group, you see only the reports that include the variable
that you selected. However, if you do not select a variable within
a given filter group, then the displayed reports can include any of
the variables that are related to the filter group.
For example, a filter
group named Machine might
include four variables that correspond to four machines in your organization:
DEVA, GOLDFINGER4, P0A2, and PERFORMANCE6. The following image shows
that if you select the variable DEVA, then only the gallery reports
for the DEVA machine appear in the Gallery pane.
When you select multiple
filter variables in the Filters pane, Gallery Manager uses different
algorithms to filter the reports based on whether the variables are
selected within a single filter group or across filter groups. The
following examples show how the Gallery Manager applies multiple filter
variables from the Filters pane:
How to Filter Reports in a Gallery
-
In the Filters pane, select the filters that you want to use to subset the reports in the open gallery. The list of available filters in the Filters pane varies based on the variables that are in the reports in the open gallery. Thus, the filters that are available for selection might change each time a new gallery is selected for filtering.Click the arrow next to a filter group to view all of the possible variables that are associated with the filter. For example, a Domain Category filter group might include several variables from which you can choose, such as VMware_GuestSystem, IBMSMF_RMFWorkload, or IBMSMF_RMFLpar. If VMware_GuestSystem is selected as the only filter variable, then only the reports for the Guest System domain category of the VMware vCenter adapter are shown in the gallery pane.
-
Click Apply. Only the reports in the gallery that meet the filter criteria appear in the Gallery pane. You can then use the Gallery pane to view the reports. For more information about the using the Gallery pane, see Gallery Pane.Note: Applying filters does not modify the gallery. It only subsets the reports in the gallery for viewing. Therefore, the applied filters last only for the current instance of the gallery. The next time you access the gallery, you will see all of the reports in the gallery and will be able to apply another set of filter criteria if necessary.
Table View
About the Table View
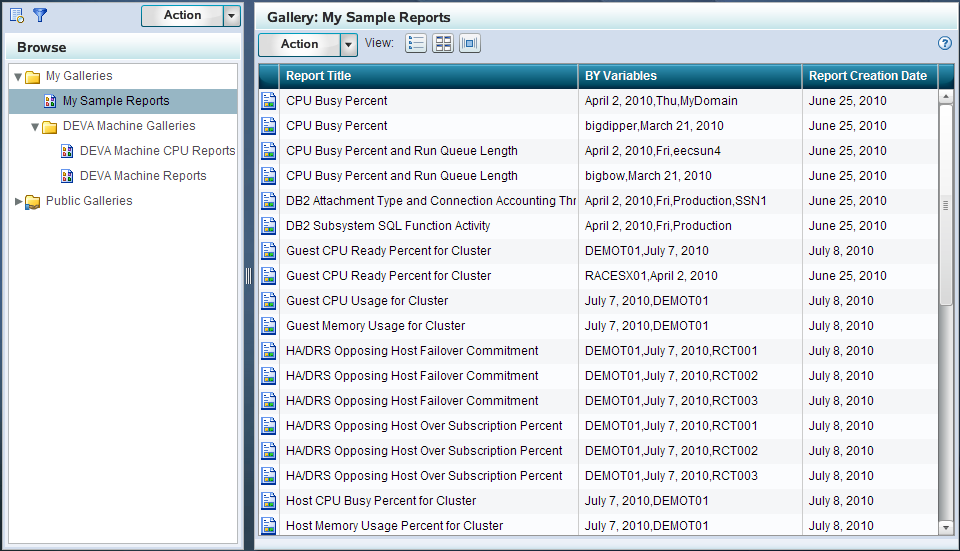
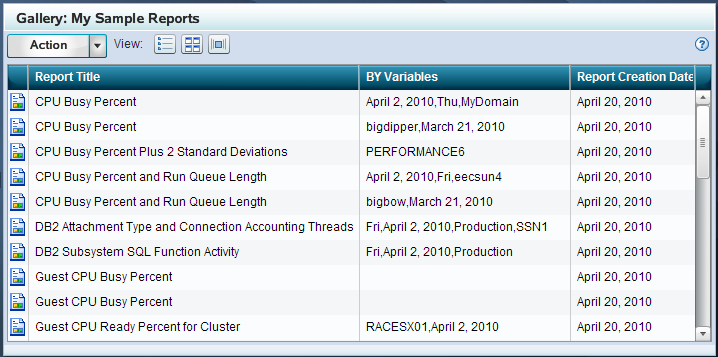
The Table view is the
default view for the reports in a gallery. This view uses a grid
format to display the following information about each report:
In the Table view, you
can drag and drop one or more reports from the Gallery pane into one
of your Favorites folders. For more information
about Favorites, see Working with Favorites.
Viewing Reports in the Table View
Click the Table view
icon ( )
) in the Gallery pane to view
the list of reports in this tabular format.
The Table view enables
you to visually scan information about the reports in the gallery.
The columns in the table include additional information about the
reports such as the title, BY variables, and creation date. You can
adjust the width of each column in the table.
To view a report in
the Table view, perform one of the following steps:
-
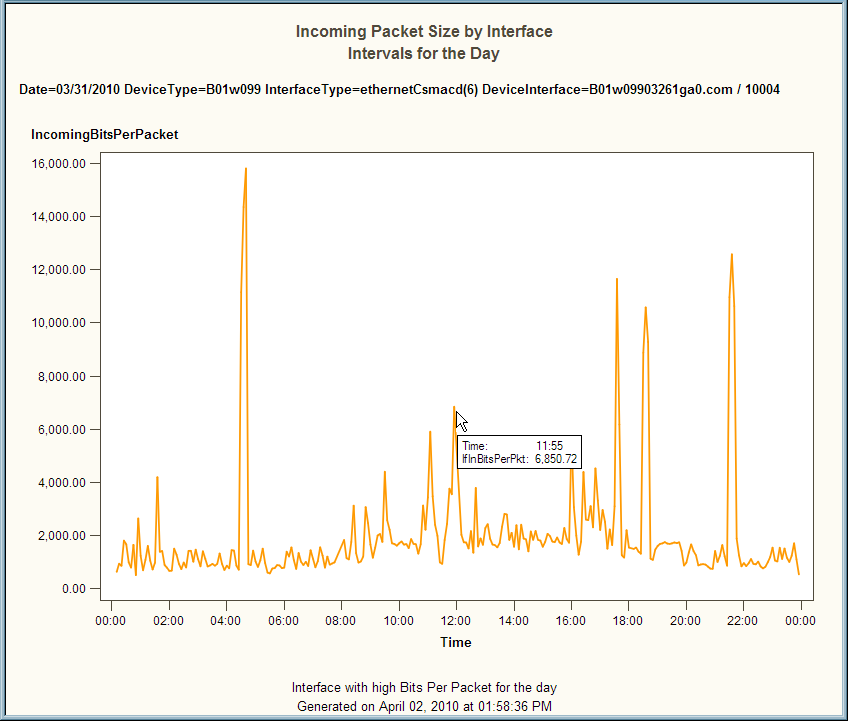
Double-click a report in the grid to open a large version of it in a separate browser window. If the report was created in an ActiveX or Java format, then you can place the mouse pointer on an area in the expanded report to view more layers of the report data.For example, the following image shows the interactive capability of an ActiveX report. When the mouse pointer is placed on a data point in the report, a tooltip provides more information about the specific data item. In this example, the user can see the exact number of incoming bits per packet at 11:55 AM on March 31, 2010.Example of an Interactive ActiveX Report
Sorting Reports in the Table View
The column headings
of the Table view enable you to sort the reports by column. The default
order is alphanumeric ascending order by report title, BY variable,
and report creation date.
When you click a column
heading in the Table view, an up arrow (ascending) or down arrow (descending)
icon appears. These arrows indicate whether the information in the
columns is sorted by ascending or descending order. For example, when
the down arrow icon ( )
) is displayed in the column
heading, then the information in that column is sorted by descending
order. You can click the arrow in a column heading to change the sort
order for that column.
 )
)Thumbnail View
About the Thumbnail View
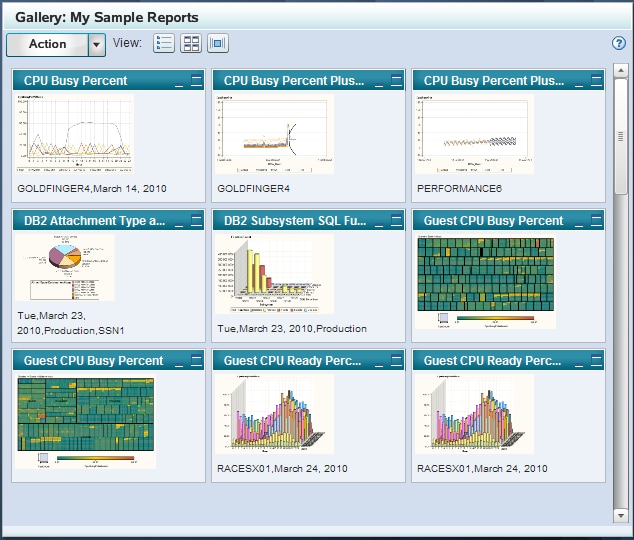
The Thumbnail view displays
reports as expandable tiles or thumbnail images that you can view
and arrange. This view displays up to nine thumbnails of reports at
one time. Each thumbnail includes the report title, BY variables,
a small image of the report, and sizing icons that enable you to increase
or decrease the size of the image in the Gallery pane.
In the Thumbnail view,
you can click the arrow next to the Action button and select Copy to Favorites to
copy the selected reports into one of your Favorites folders. For more information about Favorites, see Working with Favorites.
Viewing Reports in the Thumbnail View
Click the Thumbnail
view icon ( )
) in the Gallery pane to view
the gallery reports in this format. This format enables you to view
small images of each report in a gallery.
You can double-click
a report thumbnail to open a large version of the report in a separate
browser window. If the report was created in an ActiveX or Java format,
then you can place the mouse pointer on an area in the expanded report
to view more layers of the report data.
You can also use the
following icons at the top right of each report thumbnail to minimize
and expand the thumbnail images:
Tip
If the gallery contains more
than nine reports, then you can use the vertical scroll bar to navigate
through the entire set of reports that are in the gallery. Place the
mouse pointer on the scroll bar to see the number of reports that
are in the Gallery pane and the set of reports that are currently
displayed. For example, if you are viewing the first set of reports
in a gallery that includes 124 reports, then the tooltip states 0–9 out of 124.
Sorting Reports in the Thumbnail View
The Thumbnail view uses
the same sort order that is designated in the Table view. You can
sort the order of reports in the Table view and then view them in
that order in the Thumbnail view. For more information, see Sorting Reports in the Table View.
You can reorder the
reports in the Thumbnail view by dragging and dropping a thumbnail
onto a new location in the thumbnail grid. However, the order that
you designate is not preserved the next time you access the gallery.
In addition, the Table View and Flow view do not automatically use
the same order that you specify in the Thumbnail view.
Flow View
About the Flow View
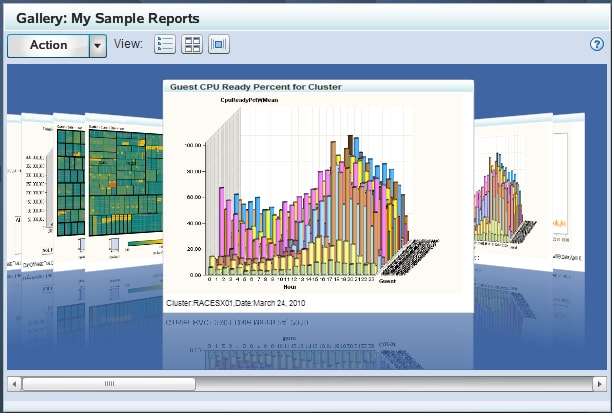
The Flow view displays
a horizontal stack of up to ten reports at one time. Each report image
includes the report title and BY variables.
In the Flow view, you
can click the arrow next to the Action button
and select Copy to Favorites to copy the
center report into a Favorites folder that you select. For more information about Favorites, see Working with Favorites.
Viewing Reports in the Flow View
Click the Flow view
icon ( )
) in the Gallery pane to view
the gallery reports in this format. This view displays stacks of ten
reports at one time. You can navigate between the first and last report
in a stack by clicking each page as if it were a page in a book. Here
are the ways that you can navigate through the reports in the Flow
view:
-
Note: Place the mouse pointer on the horizontal scroll bar to see the number of reports that are in the Gallery pane and the set of reports that are currently displayed. For example, if you are viewing the first stack of reports in a gallery that includes 124 reports, then the tooltip states 0–10 out of 124.
Sorting Reports in the Flow View
The Flow view uses the
same sort order that is designated in the Table view. You can sort
the order of reports in the Table view and then view them in that
order in the Flow view. For more information,
see Sorting Reports in the Table View.
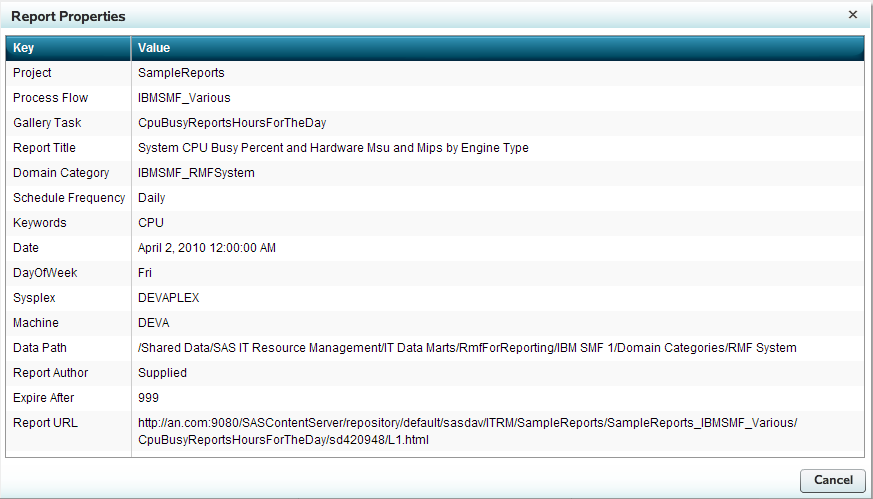
Report Properties
Gallery Manager enables
you to view the properties of a report such as the name of the corresponding
SAS Enterprise Guide project, the process flow, and the ITRM Gallery
task that was used to create the report. Thus, you can use these properties
to identify the report definition that is used to generate the SAS
IT Resource Management report.
You cannot use Gallery
Manager to modify these properties of a report. However, system administrators
can use SAS Enterprise Guide and SAS IT Resource Management to modify
the ITRM Gallery task, the report definition, and the report job to
change the SAS IT Resource Management report. For more information,
see “Part 3: Creating and Modifying Batch Reports” in SAS IT Resource Management: Reporting Guide.
The properties that
are in the Report Properties dialog box vary
based on the report and its metadata. The information for a given
report might include a combination of the following properties:
provides the name of
the SAS Enterprise Guide project that is associated with the report.
The SAS Enterprise Guide project includes the ITRM Gallery task that
creates the report definition for the report.
provides the page of
the SAS Enterprise Guide project that is associated with the report.
This page of the SAS Enterprise Guide project includes the ITRM Gallery
task that creates the report definition for the report.
provides the name of
the ITRM Gallery task that creates the report definition for the report.
The ITRM Gallery task name is the same as the report definition name.
provides the domain
category of the adapter of the report. This value enables you to filter
the report by domain category in Gallery Manager. This value in the
report definition is specified in the ITRM Gallery task.
provides the report
category, a subset of the domain category, for the report. This value
enables you to filter the report by domain subcategory in the Gallery
Manager. This value in the report definition is specified in the ITRM
Gallery task.
indicates when the
report should be scheduled to run. This value in the report definition
is specified in the ITRM Gallery task.
provides the keywords
that are assigned to the report for filtering in the Gallery Manager.
Keywords are values in the report definition and are specified in
the ITRM Gallery task.
provide other BY variables
that are in the report. Gallery Manager enables you to filter reports
by these BY variables. A report can include zero or more BY variables
in the Report Properties dialog box.
provides the location
of the information map for the report. If this report property is
blank, then the corresponding report job used the information map
in the same folder as the report job. This value is a parameter of
the report definition and can be specified in the ITRM Gallery task.
provides the user ID
that created the corresponding ITRM Gallery task in SAS Enterprise
Guide. Supplied indicates
that the resulting report definition was supplied by SAS IT Resource
Management.
indicates the number
of days, according to the report definition, that the report is saved
on the SAS Content Server until it expires and can then be overwritten
when the report job is run again. This value in the report definition
is specified in the ITRM Gallery task.
If a report is expired
and its report job is run again, then the expired report is deleted
and replaced with the new report. If a report is not expired and its
report job is run again, then the previous report remains in the system
with the new report that is generated.
Note: The Gallery transformation
in the report job can be set to ignore the ExpireAfter value in the report definition and use a different value to calculate
the expiration date for a report. For more information about specifying
parameters in the Gallery transformation, see the Help for SAS IT
Resource Management or “Working with Gallery Transformations”
in the SAS IT Resource Management: Reporting Guide.
