Creating Aggregation Tables with the Summarized Aggregation Table Wizard
To create an aggregation table (that is, the target
table) with the Summarized Aggregation Table wizard,
respond to the wizard's prompts. Whenever you have completed your
specifications for the aggregation table and want to skip the remaining
pages of the wizard, click Finish (if that
button is enabled). This action updates the Aggregation transformation
with this new aggregation table and returns you to the process flow
diagram. For
information, see How to Complete the Specification of the Summarized Aggregation Table.
How to Specify Library Information
If this aggregation
table is the first target table that is specified for this Aggregation
transformation, an additional page of the wizard opens. This page
prompts you for the physical target location and for information about
the SAS library where the data will be stored. When this page opens,
the following fields are already specified with default values. If
you want to modify these fields, perform the following steps:
-
In the Server field, enter the application server that you specified for the IT data mart that you are working with. The default application server is the SASITRM server. A value is required in this field.At installation time, SAS IT Resource Management establishes a SAS Application Server named SASITRM that sets properties such as memory size options and formats for the exclusive use of the solution. Establishing SASITRM as the SAS Application Server ensures that the SAS IT Resource Management solution can be installed and operated with other SAS products and solutions, some of which may also establish SAS Application Servers.
-
In the Libref field, enter the name that is temporarily associated with the library. The libref or an aggregation library is a concatenation of AGG and a random number (for example, AGG27040). A value is required in this field. The libref name must be unique within the application server.
How to Select a Filter and Enable Data Duplication Checking
Filters can limit the
amount of data that is input to an aggregation table. To select a
filter and a column for data-duplication checking, perform the following
steps:
-
The Expression field displays the formula that defines the filter. It cannot be changed from this location. For information about how to modify the expression field of a filter, see Modify a Filter of an Aggregation Transformation.
Note: For more information
about how to work with filters, see Working with Aggregation Transformation Filters .
Specify Aging Columns
Managing Your Data: Aging and Purging Options
SAS IT Resource Management
provides several ways of managing the amount of data that is kept
in the aggregation tables of your IT data mart. You can apply the
aging and purging functions to both simple and summarized aggregations.
The selection of the aging and purging attributes for a simple or
a summarized aggregation table can be performed on the Specify
aging page of the wizard.
-
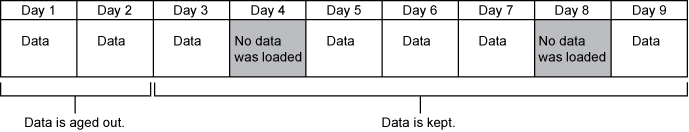
By entering a value for the Age limit in days, you are specifying the age range that data will be present in the table. The minimum number of days is 1; the maximum number of days is 9999.Note: Columns that are used for aging are DATETIME columns. For these columns, one day of aging extends over 24 hours of data collection, which might extend over one or more days.You are not specifying that the data is to be aged out after that number of days. Instead, the value that you specify is the number of days of data that you want to keep. Calculate what is aged out by subtracting the value of the Age limit in days from the latest date of the new or existing data. The resulting date is the date before which data will age out. For example, in the following figure, Day 9 is the latest date of the data and the Age limit in days is seven.
How to Specify Aging Criteria
You can specify whether
and how you want to age your data when you define the aggregation
target table. Based on these specifications, data will be kept in
the aggregation table or aged out of it. To specify aging criteria
for the target table, perform the following steps:
-
To perform aging for the target table, check the corresponding check box. This action enables you to select the column to be used for aging and to specify the format of that column.
-
The Column field displays a list of the columns from the source table that are available to use for aging the data. From the drop-down list, select the column that you want to use. It is displayed in the Column field. The format of the selected field is displayed.Note: If you want to specify percent change or moving statistic columns, you must select an aging column. SAS IT Resource Management uses that aging column in order to calculate the period-to-period changes for that column. The selected aging column is automatically added to the list of class columns for a summarized aggregation table.
-
-
To specify the completed day, check the corresponding check box. This action enables you to select the column to use to determine whether a day is complete. (This option is enabled if aging has been specified for this aggregation table and the source table has a column called DATETIME.)This feature is useful only for tables where the aging column represents a DAY or less. For example, this feature is not useful for WEEKDATE aggregations.Note: If the Apply completed day option is deselected on an existing aggregation table that previously selected that option, the rank columns of that table are analyzed. If they depend on Completed Day being selected, a message is displayed that lists the rank columns that would be affected. The deselection of the Completed Day option is not permitted.
Specify Class and ID Columns
About Specifying Class and ID Columns
On the Specify
class and ID columns page, you can specify the columns
from the source table that are to be included in the target aggregation
table as class columns and as ID columns.
Note: If an input column is given
a role as a class column, ID column, or a statistic, it cannot simultaneously
be assigned a different role. Therefore, it will not be available
for selection. If all available columns are assigned as class or ID
columns, then no columns will be available to be used as statistic,
percentile, percent change, moving statistics, or rank columns. In
that case, the wizard will not display the pages that enable you to
specify those columns.
How to Specify Class and ID Columns
You can select the entire
list of available columns by clicking the double right arrow. Back
arrows can be used to deselect one, several, or all columns.
Tip
After your data has been aggregated,
you can change the class list. If you remove columns from the class
list, the existing data in the summarized aggregation table is merged
again so that it matches the new class list. If you add new columns
to the class list, then these new columns in the summarized aggregation
table will have a missing value (for numeric) or blank value (for
character) in the existing data.
Specify Statistics Columns
About Specifying Statistics
On the Specify
statistics page, you can calculate or delete one or more
statistics on analysis columns that you selected on the previous page.
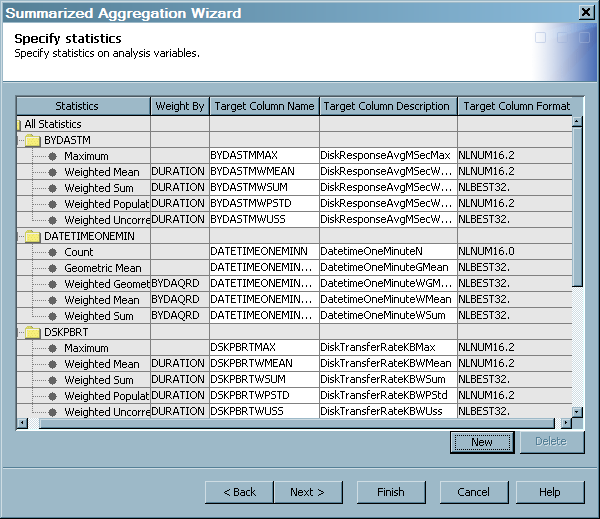
These columns are displayed in a grid format, which contains a row
for each analysis column. The grid contains the following columns: Analysis
Column and Statistics, Weight By, Target
Column Name, Target Column Description,
and Target Column Format. Except for the Analysis
Column and Statistics column, which displays the names
of the selected analysis and statistics columns, the columns of the
grid are blank until the statistic is specified.
Note: For the list of statistics
that SAS IT Resource Management enables you to create, see Statistics.
How to Create Statistics for an Analysis Column
-
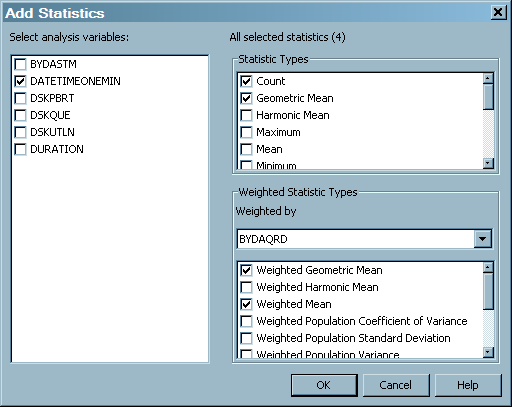
In the Select analysis variables panel, check the box next to the analysis column for which you want to specify statistics. (Checking multiple analysis columns enables you to specify the same statistics for all the analysis columns that you selected. Otherwise, check an analysis column and specify the statistics for it individually.)
-
Click OK to add the requested and any underlying statistics to the grid under the analysis column. The row displays these statistics along with its attributes, such as Weight By, Target Column Name, Target Column Description, and Target Column Format. These fields contain the default values that are associated with the statistics. To modify a field on this grid, highlight it, and change it as needed by entering the revision in the field.
How to Modify a Statistic Column
You can modify only
the Target Column Name, Target
Column Description, and Target Column Format fields
on the grid. (The Weight By column cannot
be modified.)
How to Delete a Statistic Column
How to Delete Multiple Statistics Columns
In some instances, you
might want to delete multiple columns at the same time. For example,
you might want to delete all of the statistic columns for a particular
analysis column, or only some of them. You can delete all of the statistic
columns for a particular analysis column by either selecting all the
statistic columns individually, or by selecting the analysis column
itself. Either action will accomplish the same purpose.
However, if your selection
of columns to delete includes an analysis column and some, but not
all, of the statistic columns for that analysis column, a message
is displayed. The message states that you selected conflicting choices
and that no columns will be deleted. The message advises you to select
either an analysis column or one or more statistics columns.
Specify Percentiles Columns
About Specifying Percentiles
Percentile measurements
in SAS IT Resource Management enable IT organizations to quantify
and analyze utilization, availability, performance, and capacity characteristics
of IT infrastructure components. These measurements can be compared
with other components or other time periods in the infrastructure
so that IT organizations can prioritize and resolve current day and
potential problems.
Note: Jobs that calculate percentile
columns might require longer processing times because the data might
have to be read multiple times. For best results, minimize the number
of percentile columns that you specify.
On the Specify
percentiles page, you can request that multiple percentiles
be generated for an input metric. Percentile information is displayed
in a grid format, which contains a row for each percentile that is
being calculated. The grid contains the following columns: Input
Column and Percentiles, Round To, Target
Column Name, Target Column Description,
and Target Column Format.
Note: Each requested percentile
for a given analysis column must use the same precision of granularity,
that is, it must specify the same rounding. If you specify a different
precision of granularity for the same analysis column, a message is
displayed indicating that the granularity will be changed to that
of the first analysis column.
How to Create Percentiles for an Analysis Column
-
In the Select variables panel, check the box next to the analysis column for which you want to specify percentiles. (Checking multiple analysis columns enables you to specify the same percentiles for all the analysis columns that you selected. Otherwise, check an analysis column and specify the percentile characteristics for it individually.)
How to Modify a Percentile Column
You can modify only
the Target Column Name, Target
Column Description, and Target Column Format fields
on the grid. (The Round To column cannot
be modified.)
How to Delete a Percentile Column
How to Delete Multiple Percentile Columns
In some instances, you
might want to delete multiple columns at the same time. For example,
you might want to delete all of the percentile columns for a particular
analysis column, or only some of them. You can delete all of the columns
for a particular analysis column by either selecting all the columns
individually, or by selecting the analysis column itself. Either action
will accomplish the same purpose.
However, if your selection
of columns to delete includes an analysis column and some, but not
all, of the percentile columns for that analysis column, a message
is displayed. The message states that you selected conflicting choices
and that no columns will be deleted. The message advises you to select
either an analysis column or one or more percentile columns.
Specify Percent Change Columns
About Specifying Percent Change
You can calculate the
percent change of a resource’s given statistic or percentile
in specified time periods and compare the results from one time period
to another. This enables you to see the percent change of the statistic
or percentile column for a resource in one time period and compare
it to the same statistic or percentile for this same resource in another
time period. The percent change metric is useful for capacity planning.
Percent change information
is displayed in a grid format, which contains a row for each statistic
that is being calculated. The grid contains the following columns: Statistic
and Percentile, Weight By, Input
Column, Target Column Name, Target
Column Description, and Target Column Format.
How to Modify a Percent Change Column
You can modify only
the Target Column Name, Target
Column Description, and Target Column Format fields
on the grid. (The Weight By cannot be modified.)
How to Delete a Percent Change Column
How to Delete Multiple Percent Change Columns
In some instances, you
might want to delete multiple columns at the same time. For example,
you might want to delete all of the percent change columns for a particular
analysis column, or only some of them. You can delete all of the columns
for a particular analysis column by either selecting all the columns
individually, or by selecting the analysis column itself. Either action
will accomplish the same purpose.
However, if your selection
of columns to delete includes an analysis column and some, but not
all, of the percent change columns for that analysis column, a message
is displayed. The message states that you selected conflicting choices
and that no columns will be deleted. The message advises you to select
either an analysis column or one or more percent change columns.
Specify Moving Statistic Columns
About Specifying Moving Statistics
Moving statistics enable
IT organizations to identify and establish baseline and threshold
measurements for the many performance measurements that they want
to measure. This statistic can also be used to monitor characteristics
of the SAS IT Resource Management system. For example, it can help
monitor the growth in the number of systems for which data is analyzed,
or the volume of reports created by each SAS IT Resource Management
report job (if measures on those items are retained and managed using
SAS IT Resource Management).
On the Specify
moving statistic page, you can request that multiple
moving statistics be generated for a statistic or a percentile. (Moving
statistics cannot be created directly on an input column.) The following
types of moving statistics can be created:
Moving statistic information
is displayed in a grid format, which contains a row for each moving
statistic that is being calculated. The grid contains the following
columns: Statistic and Percentile, Input
Column, Number of Periods, Moving
Statistic Type, Target Column Name, Target
Column Description, and Target Column Format.
How to Create Moving Statistics for a Statistic or Percentile Column
-
In the Select columns panel, check the box next to the statistic or percentile column for which you want to specify moving statistics. (Checking multiple statistic or percentile columns enables you to specify the same moving statistics for all the columns that you selected. Otherwise, check a statistic or percentile column and specify the moving statistics and its characteristics individually.)
-
Click OK to add the requested moving statistics to the grid. The row displays these moving statistics along with their attributes, such as Round To, Target Column Name, Target Column Description, and Target Column Format.Note: If more than one moving statistic is specified for the same column, a number is appended to the Target Column Name. This number is incremented by one for every new moving average that is specified for a column. For example, if you specified a moving average column of name CPUBusyPct_MA, then if another moving average column is requested for CPUBusyPct, then by default it should be called CPUBusyPct_MA1.
How to Modify a Moving Statistics Column
You can modify only
the Target Column Name, Target
Column Description, and Target Column Format fields
on the grid. (The Round To column cannot
be modified.)
How to Delete a Moving Statistics Column
How to Delete Multiple Moving Statistics Columns
In some instances, you
might want to delete multiple columns at the same time. For example,
you might want to delete all of the moving statistics columns for
a particular analysis column, or only some of them. You can delete
all of the columns for a particular analysis column by either selecting
all the columns individually, or by selecting the analysis column
itself. Either action will accomplish the same purpose.
However, if your selection
of columns to delete includes an analysis column and some, but not
all, of the moving statistics columns for that analysis column, a
message is displayed. The message states that you selected conflicting
choices and that no columns will be deleted. The message advises you
to select either an analysis column or one or more moving statistics
columns.
Specify Ranking Columns
About Ranking
You can specify ranking
for class, ID, statistics, percentiles, percent change, and moving
statistics columns. The ranking of data determines the position of
the value of a column or a value within a selected group of class
columns. You can specify that ranks be computed on class columns,
ID columns, or statistical columns. Only numeric columns can be ranked.
SAS IT Resource Management
computes a dense rank, which means that the rank numbers are sequentially
numbered, without gaps. The ranks start with 1 and are incremented
by 1. Ties receive the same rank. For more information about ranking,
see “The RANK Procedure” chapter in the Base SAS Procedures Guide.
Ranks are computed before
the calculation of computed columns so that ranks can be used in the
calculation of a computed column.
On the Specify
ranking page, you can specify the columns that you want
to rank and how these columns should be ranked. You can also delete
a rank column. Rank columns are displayed in a grid format, which
contains a row for each defined rank column. The grid contains the
following columns: Rank Columns, Target
Column Name, Target Column Description, Rank
Order, Rank Grouping, and Completed
Days, which are all initially blank until you add a ranking
specification for a column.
How to Specify Ranking for a Column
-
To rank columns over all the data, click the corresponding option. (The list of columns with this option includes numeric class and ID columns that you selected from the source table as well as the statistics, percentile, percent change, and moving statistics columns that you specified on the previous page.)
-
Alternatively, to rank columns over specific class columns, click the corresponding option. (The list of columns with this option includes only the statistics columns that you specified on the previous page.) In the Rank over the following class columns box, check the class columns over which you want to rank selected columns.Note: You can select any class columns over which to rank the selected statistic. However, you should leave at least one class column deselected. The class columns that are not selected are the columns over which the statistic is to be ranked. For example, you might have an aggregation table of average CPU Utilization, and the class columns are DAYDATE, DOMAIN, and MACHINE. If you request a descending rank of Average CPU Utilization using a Rank Grouping of DAYDATE and DOMAIN, then that request would result in a ranking of Average CPU utilization for all machines within the DOMAIN for the given DAYDATE. Thus, the observation where the rank value is 1 would be the machine with the highest average CPU utilization, ranked separately for each unique DOMAIN and DAYDATE combination. Alternatively, if you request a descending rank of Average CPU Utilization using a Rank Grouping of DAYDATE, DOMAIN, and MACHINE, then that request would result in a ranking of Average CPU utilization for a single row of data, which is not a useful ranking.
How to Modify a Rank Column
How to Delete a Rank Column
How to Delete Multiple Rank Columns
In some instances, you
might want to delete multiple columns at the same time. For example,
you might want to delete all of the rank columns for a particular
analysis column, or only some of them. You can delete all of the columns
for a particular analysis column by either selecting all the columns
individually, or by selecting the analysis column itself. Either action
will accomplish the same purpose.
However, if your selection
of columns to delete includes an analysis column and some, but not
all, of the rank columns for that analysis column, a message is displayed.
The message states that you selected conflicting choices and that
no columns will be deleted. The message advises you to select either
an analysis column or one or more moving statistics columns.
Specify Join Columns
About Join Columns
Note: Jobs that include joined
columns might require lengthy processing time. For best results, minimize
the number of joined columns that you specify.
Information about join
columns is displayed in a grid format, which contains a row for each
column that is to be joined. The grid contains the following columns: Source
Columns, Target Column Name, Target
Column Description, and Target Column Format.
The entries in the grid are initially blank.
How to Specify Join Columns
To add a join column
from an existing table to the table that you are specifying, perform
the following steps:
-
Select columns from the list in the Available Columns. Use the arrow to transfer those columns to the Selected Columns panel and click OK. The selected columns are entered automatically into the appropriate cells of the grid, along with their corresponding default values for Target Column Name, Target Column Description, and Target Column Format.
How to Modify a Join Column
How to Delete Multiple Join Columns
In some instances, you
might want to delete multiple columns at the same time. For example,
you might want to delete all of the join columns from a particular
table, or only some of them. You can delete all of the columns for
a particular table by either selecting all the columns individually,
or by selecting the table itself. Either action will accomplish the
same purpose.
However, if your selection
of columns to delete includes a source table and some, but not all,
of the join columns for that table, a message is displayed. The message
states that you selected conflicting choices and that no columns will
be deleted. The message advises you to select either a source table
or one or more join columns.
Specify Computed Columns
About Computed Columns
A computed column
stores the results of computational tasks. For example, a computed
column can be used to convert unit measurements so that all the data
uses the same standardized units of measurement. You can add, modify,
or delete computed columns on the Add or modify computed
columns page that is available in the Summarized
Aggregation Table wizard or the Simple Aggregation
Table wizard. By default, a computed column is numeric.
Note: If you change a computed
column, the values for the computed column are recalculated for that
column in all rows of the data when the job is executed. (This recalculation
is performed even if no new data is added to the aggregation table.)
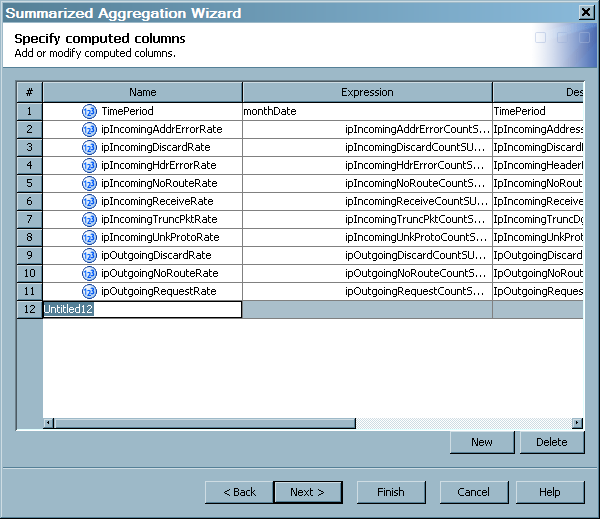
The Specify
computed columns page displays a grid that shows the
following fields for each computed column: Name, Expression, Description, Length, Type, Informat,
and Format.
Tip
A computed column called TimePeriod is
automatically added to every simple and summarized aggregation table.
Its value is always the same as the aging column, and you can refer
to TimePeriod instead of referring
to the aging column directly. This technique simplifies reporting,
especially in those instances where you do not know the name of the
aging column. (If no aging is specified for the target table, then
the field is set to missing.) The expression for this column is defined
when the aggregation wizard is completed. For example, if the aging
column of an aggregation table is DAYDATE, the expression for the
TimePeriod computed column is DAYDATE and its expression is TIMEPERIOD=DAYDATE;.
How to Add a Computed Column
To add a computed column
to the aggregation table, on the Computed Columns page
of the aggregation wizard, perform the following steps:
-
Enter the values that you want to use for the Name, Expression, and Description fields. You can enter values for the Length, Type, Informat, and Format fields, or you can accept the default values for these fields.Note: You can use a SAS macro in a formula expression or in the expression for a computed column. The SAS macro definition needs to be available to the SAS session that executes the staging or aggregation job that populates the computed column. For example, you might need to add a new autocall library using the SASAUTOS SAS option in the SAS configuration.
How to Modify a Computed Column
-
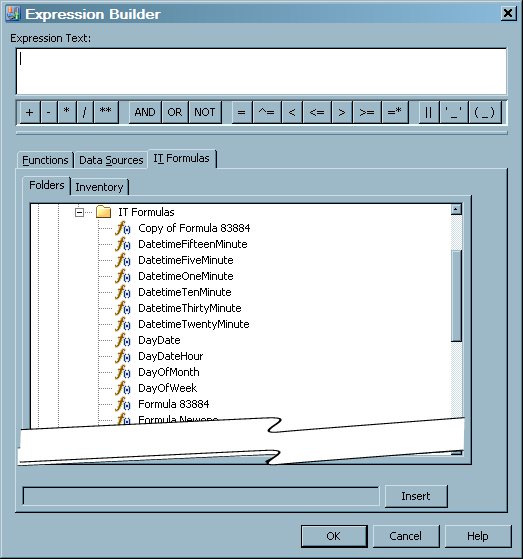
In the Expression field, you can specify a modified computation for this computed column by entering it in this field or by using the Expression Builder function. Double-click in the field and click ... to open the Expression Builder window.Many functions are available from the Functions and Data Sources tabs of this window. In addition, the Expression Builder window provides another tab to assist you in defining the computation for this column—the IT Formulas tab.
-
The Data Sources tab of the Expression Builder window lists all the columns that are generated in the aggregation table output. Select the column that you want to use in the expression and click Insert.For simple aggregations, the Data Source tab displays all the output columns that you selected for the simple aggregation table. For the summarized aggregation table, the Data Source tab displays all the class, ID, statistic, percent change, rank, and join columns that you selected for the summarized aggregation table. In addition, it displays the system-generated LastUpdated, CompletedDay, and ContribCount columns.All column names that are used in the computation are the output column names. For example, if you choose to use an input column named SYSTEM as a class column, you might rename it MACHINE. Then, if you want to use that column when defining a computed column, you should refer to that column as MACHINE, not SYSTEM.
In addition to the conventional rValue expression, SAS IT Resource Management also supports more complex expressions. (An rValue expression is an expression that consists of code that is appropriate only for the right-hand side of an assignment statement.) For example, your expression can use SAS code that might include loops, IF statements, and so on. This code must be written in valid SAS DATA step syntax.Note: You can use a SAS macro in a formula expression or in the expression for a computed column. The SAS macro definition needs to be available to the SAS session that executes the staging or aggregation job that populates the computed column. For example, you might need to add a new autocall library using the SASAUTOS SAS option in the SAS configuration.When you are satisfied with the expression that you defined, click OK in the Expression Builder window. This action closes that window and places the expression in the appropriate field of the computed column. -
In the Type field, you can change the type of the computed column. Double-click in the field and use the arrow to display the drop-down list of valid types (either character or numeric). From this list, you can select the appropriate type for this computed column. Fields that are the result of a calculation should be specified as numeric. By default, the computed column is numeric.
-
In the Length field, you can change the length of the computed column. For numeric type columns (not character type columns), this numeric value must be from 2 through 8. (Reducing the length of a numeric computed column might introduce precision errors.) For character computed columns, the length can be from 1 through 32767.
How to Delete a Computed Column
Deleting a computed
column removes it from the metadata for a table. The column will no
longer be generated when the Aggregation transformation job is run.
However, deleting a computed column does not remove the column from
the physical tables of aggregated data that have already been generated.
When you have finished
working with your computed columns, click Next to
continue to the final page of the wizard.
Note: After the job is redeployed
and executed, changes to the computed columns will be reflected in
the physical table. For information about redeploying jobs, see Redeploy All Jobs on the Server.
How to Complete the Specification of the Summarized Aggregation Table
The final page of the
wizard displays the details for the summarized aggregation table that
you specified. If you are satisfied with your choices, click Finish.
Click OK to return to the process flow diagram.
In the metadata, aggregation
tables are stored in sorted order, with an asserted
BY-processing can be performed using the class list,
if the BY list matches the same SORTEDBY assertion. With SAS IT Resource
Management, you can leverage SAS Data Integration Studio to define
additional indexes for use where BY-processing is required. If you
require a sorted aggregation table, you can input that table to a
SORT transformation and store the resulting table wherever you want.
SORTEDBY= data
set option. The SORTEDBY assertion reflects that the data is stored
in the following order:
-
alphabetical list of the remaining class columns
-
aging column
For information about
indexes, see Indexing an Aggregation Table.