| Module Library |
RANDMULTINOMIAL Function
generates a random sample from a multinomial distribution
- RANDMULTINOMIAL( N, NumTrials, Prob )
The inputs are as follows:

- is the number of desired observations sampled from the
distribution.
- is the number of trials for each observation.
![numtrials[j] \geq 0](images/modlib_modlibeq39.gif) , for
, for  .
. - Prob
- is a
 vector of probabilities with
![0 \lt {prob}[j] \leq 1](images/modlib_modlibeq42.gif) and
and ![\sigma_{j=1}^p {prob}[j] = 1](images/modlib_modlibeq43.gif) .
.
The multinomial distribution is a multivariate generalization of the binomial distribution. For each trial,
The RANDMULTINOMIAL function returns an
If
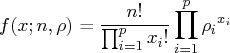
- the probability density function for
 is
is
- the expected
value of
 is
is  .
. - the variance of is
 .
. - the covariance of with
 is
is  .
. - if
 then
then  is constant.
- if
 then
then  is Binomial
 and
and
 is Binomial
 .
.
The following example generates 1000 samples from a multinomial distribution with three mutually exclusive events. For each sample, 10 events are generated. Each row of the returned matrix x represents the number of times each event was observed. The example then computes the sample mean and covariance and compares them with the expected values. Here are the code and the output:
    call randseed(1);
    prob = {0.3,0.6,0.1};
    NumTrials = 10;
    N = 1000;
    x = RANDMULTINOMIAL(N,NumTrials,prob);
    ExpectedValue = NumTrials * prob`;
    Cov = -NumTrials*prob*prob`;
    /* replace diagonal elements of Cov with Variance */
    Variance = -NumTrials*prob#(1-prob);
    d = nrow(prob);
    do i = 1 to d;
       Cov[i,i] = Variance[i];
    end;

    SampleMean = x[:,];
    n = nrow(x);
    y = x - repeat( SampleMean, n );
    SampleCov = y`*y / (n-1);
    print SampleMean, ExpectedValue, SampleCov, Cov;


             SampleMean                          ExpectedValue

      2.971     5.972     1.057              3        6        1

             SampleCov                               Cov

      2.0622212 -1.746559 -0.315663        -2.1     -1.8     -0.3
      -1.746559 2.3775936 -0.631035        -1.8     -2.4     -0.6
      -0.315663 -0.631035 0.9466977        -0.3     -0.6     -0.9
For further details about sampling from the multinomial distribution, see Gentle 2003, p. 198, or Fishman 1996, pp. 224 - 225.
Copyright © 2009 by SAS Institute Inc., Cary, NC, USA. All rights reserved.