Techniques for Managing BY Group Plots
You can use BY-group plots more effectively if you understand a few details about the way BY-group plots are implemented in SAS/IML Studio.
When you create BY-group plots, the following steps occur:
A new variable, _ObsNum_, is added to the current data table.
The observations that correspond to each BY groups are identified.
The observations in each BY group are copied to a new DataObject. (See SAS/IML Studio for SAS/STAT Users for details about the DataObject class.) The variables that are copied depend on the Individual plots can reference all variables option on the BY Options tab, shown in Figure 12.5.
The plots are created.
If all observations in a BY group are excluded from plots, the BY group is not copied and no plot is created.
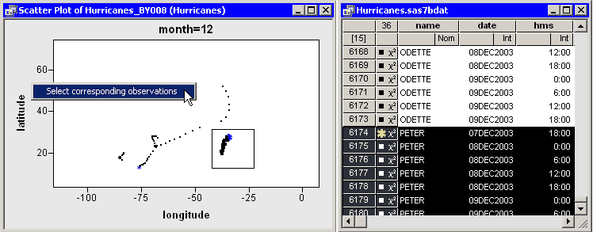
The BY-group plots are not dynamically linked to the original data. Consequently, selections made to the original data are not reflected in the BY groups. However, you can use an action menu to select observations in the original data that correspond to selected observations in a BY-group plot. See the online Help for a description of action menus.
Figure 12.14 illustrates the action menu. Press the F11 key to display the action menu in a BY-group plot. When you select the action menu item, SAS/IML Studio looks at the values of the _ObsNum_ variable for the selected observations. SAS/IML Studio then selects observations in the original data that contain the same values of _ObsNum_, as shown in the right-hand portion of Figure 12.14.
Using the action menu to select observations is a cumulative process: if an observation in the original data was selected prior to this action, it remains selected after the action. You can clear selections in the data table the usual way: press the ESC key or click in the upper left cell of the data table.
The Layout field shown in Figure 12.5 determines how many BY-group plots are displayed on the screen. If you create more BY-group plots than can fit on the screen, then the remaining plots are created as hidden windows.
You can use the Workspace Explorer to manage BY-group plots. The Workspace Explorer is described in Workspace Explorer.
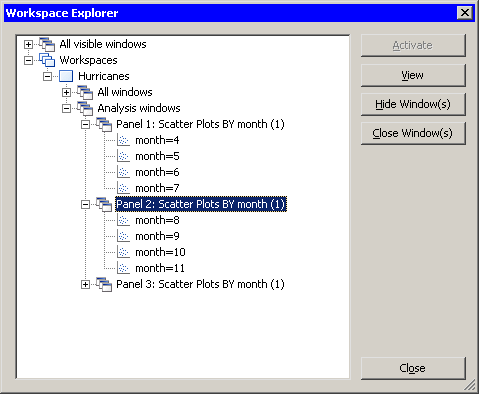
For example, if you recreate the previous example, but select 2x2 for the Layout field, then only the first four plots are displayed. You can select Windows  Workspace Explorer from the main menu to display the Workspace Explorer, as shown in Figure 12.15. You can select "Panel 2" and click View to see the next four plots. You can also hide an entire panel by clicking Hide Window(s). Finally, you can compare plots that belong to different panels by selecting each individual plot and clicking View.
Note:The number of plots that you can display on the screen at one time is limited by Windows resources. The number of plots you can create depends on characteristics of your PC; a typical PC can create a few hundred. SAS/IML Studio prevents you from creating more than 128 BY-group plots on the screen. If you need to create more plots than this limit, use the options on the BY Options tab to write the plots to the output document or to send the plots to files.