BY Options Properties
This section describes the BY Options tab that is associated with plots.
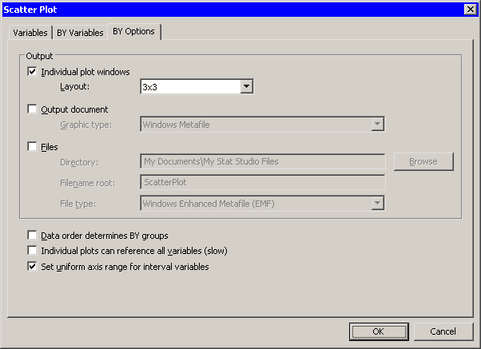
The BY Options tab controls how data are divided into subsets and how the plots are displayed. The BY Options tab (shown in Figure 12.5) contains the following UI controls:
- Individual plot windows
-
specifies whether to display plots on the screen. - Output document
-
specifies whether to copy plots to the output document.- Graphic type
specifies the image type for plots copied to the output document.
- Files
-
specifies whether to write plots to files on the client (or a networked drive).- Directory
specifies the directory for writing plots to files.- Filename root
specifies the prefix used for writing plots to files. The plots are named Root001, Root002, and so on. The suffix of each file corresponds to an enumeration of the BY groups. Existing files with the same name are overwritten.- File type
specifies the image type for plots written to files.
- Data order determines BY groups
This option corresponds to the NOTSORTED option in the BY statement in SAS procedures. If this option is selected, then no sorting is done prior to forming the BY groups. If this option is not selected, then the BY variables are internally sorted and the BY groups consist of observations that correspond to the unique values of the BY variables.- Individual plots can reference all variables (slow)
If this option is selected, then all variables are copied when forming BY groups. If this option is not selected, then the BY groups contain only the variables that are specified on the Variables and BY Variables tabs. This option is available only when Individual plot windows is selected.
- Set uniform axis range for interval variables
If this option is selected, then the axes of interval variables are set to a common range. If this option is not selected, each axis is scaled individually according to the data in each BY group. This option is ignored for a rotating plot and for nominal axes. This option does not affect the frequency axis for histograms or bar charts.