| Getting Started with SAS/IML Studio |
Create a Scatter Plot
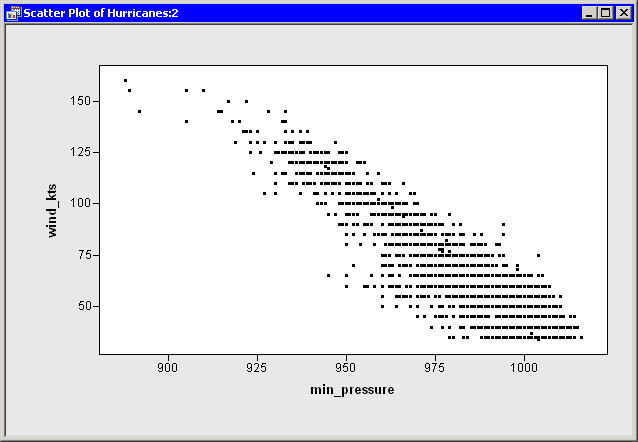
The following steps examine the relationship between wind speed and atmospheric pressure for tropical cyclones. The National Hurricane Center routinely reports both of these quantities as indicators of a storm’s intensity. The figures in this section assume that you have excluded observations with low wind speeds as described in the section Exclude Observations.
Select Graph  Scatter Plot from the main menu.
The Scatter Plot dialog box appears. (See Figure 2.13.)
Figure 2.13
Scatter Plot Dialog Box
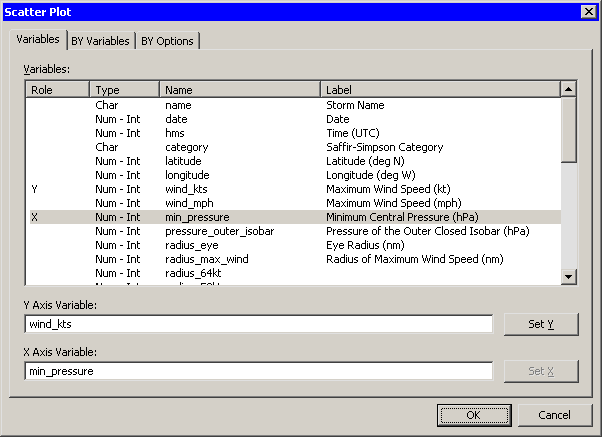
Select the variable wind_kts, and click Set Y.
Select the variable min_pressure, and click Set X.
Click OK.
A scatter plot appears as in Figure 2.14.
Figure 2.14
Wind Speed versus Minimum Pressure
Copyright © SAS Institute, Inc. All Rights Reserved.