| Getting Started with SAS/IML Studio |
Exclude Observations
To exclude observations of less than tropical storm intensity (wind speeds less than 34 knots):
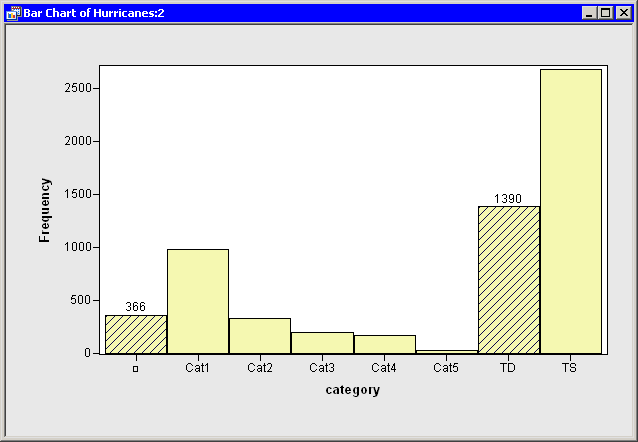
In the bar chart, click the bar labeled with the symbol  .
.
This selects observations for which the category variable has a missing value. For these data, "missing" is equivalent to an intensity of less than tropical depression strength (wind speeds less than 22 knots).
Hold down the CTRL key and click the bar labeled "TD."
When you hold down the CTRL key and click, you extend the set of selected observations. In this example, you select observations with tropical depression strength (wind speeds of 22–34 knots) without deselecting previously selected observations. The bars that contain selected observations are shown as crosshatched in Figure 2.5.
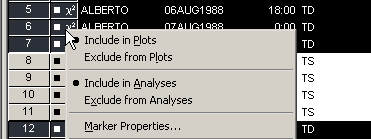
In the data table, right-click in the row heading (to the left) of any selected observation, and select Exclude from Plots from the pop-up menu (shown in Figure 2.6).
Notice that the bar chart redraws itself to reflect that all observations being displayed in the plots now have at least 34-knot winds. Notice also that the square symbol in the data table is removed from observations with wind speeds less than 34 knots.
In the data table, right-click in the row heading of any selected observation, and select Exclude from Analyses from the pop-up menu.
Notice that the  symbol is removed from observations with wind speeds less than 34 knots. Future analysis (for example, correlation analysis and regression analysis) will not use the excluded observations.
Click any data table cell to clear the selected observations.
Note:You can also exclude selected observations by using a keyboard shortcut. Select a plot and press the 'e' key to exclude selected observations from plots and from analyses. Additional keyboard shortcuts are described in Chapter 8, Interacting with Plots.
Copyright © SAS Institute, Inc. All Rights Reserved.