| Getting Started with SAS/IML Studio |
Create a Bar Chart
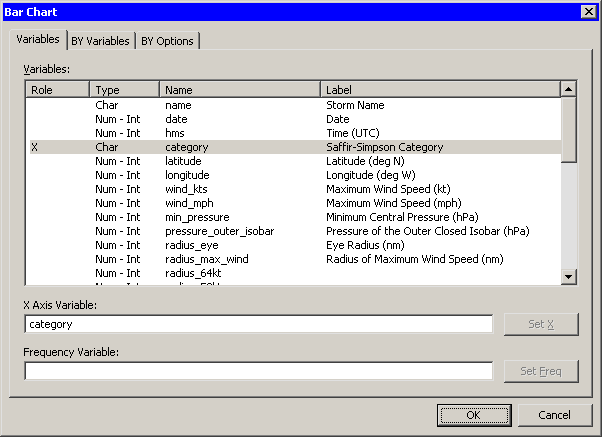
To create a bar chart of the category variable:
Select Graph  Bar Chart from the main menu.
The Bar Chart dialog box appears. (See Figure 2.3.)
Select the variable category, and click Set X.
Note:In most dialog boxes, double-clicking a variable name adds the variable to the next appropriate box.
Figure 2.3
Bar Chart Dialog Box
Click OK.
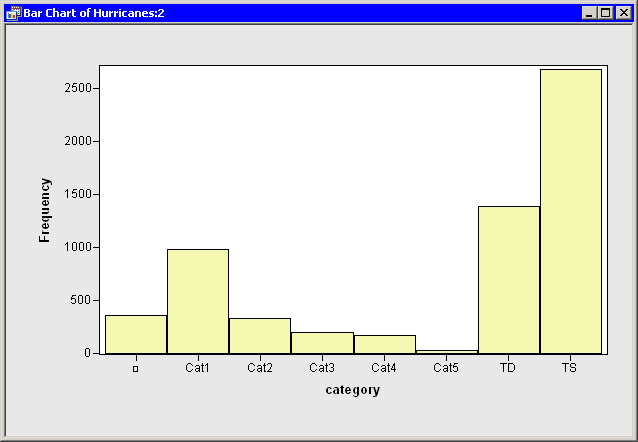
The bar chart in Figure 2.4 appears. The bar chart shows the number of observations for storms in each Saffir-Simpson intensity category.
Figure 2.4
A Bar Chart
Copyright © SAS Institute, Inc. All Rights Reserved.