Defining a Basic Lattice
Setting Grid Dimensions
Assume you want a grid of five plots. Before starting to write code,
you must first decide what grid dimensions you want to set (how many
columns and rows) and whether you want to permit an empty cell in
the grid. If you do not want an empty cell, you must limit the grid
to five cells, which gives you two choices for the grid dimensions:
five columns by one row (5x1), or one column by five rows (1x5).
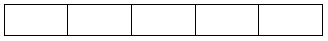
To specify grid size,
you use the ROWS= and COLUMNS= options in the LAYOUT LATTICE statement.
These options can be used in three ways to create the following grid,
which contains one row and five columns:
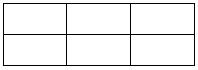
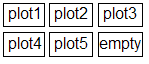
If you are willing to have an
empty cell in the grid, you could use a 2x3 or a 3x2 grid:
layout lattice / columns=3 rows=2 ;
endlayout;
Note: The LAYOUT LATTICE statement
honors the full specification of columns and rows, unlike the LAYOUT
GRIDDED statement, which honors only COLUMNS= or ROWS=, depending
on the ORDER= setting.
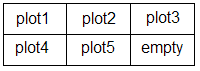
By default, the layout uses the ORDER=ROWMAJOR setting
to populate grid cells. This specification essentially means "fill
in all cells in the top row (starting at the top left) and then continue
to the next row below":
layout lattice / columns=3 rows=2 ;
  /* plot1 definition */
  /* plot2 definition */
  /* plot3 definition */
  /* plot4 definition */
  /* plot5 definition */
endlayout;
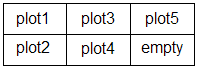
Alternatively, you can
specify ORDER=COLUMNMAJOR, which means "fill in all cells in the left
column and then continue to the next column to the right":
layout lattice / columns=3 rows=2 order=columnmajor ;
  /* plot1 definition */
  /* plot2 definition */
  /* plot3 definition */
  /* plot4 definition */
  /* plot5 definition */
endlayout;
Setting Gutters
To conserve space, the
default LATTICE layout does not include a gap between cell boundaries.
In some cases, this might cause the cell contents to appear too congested.
You can add a vertical gap between all cells with the COLUMNGUTTER=
option, and you can add a horizontal gap between all rows with the
ROWGUTTER= option. If no units are specified, pixels (PX) are assumed.
layout lattice / columns=3 rows=2 columngutter=5 rowgutter=5 ;
  /* plot1 definition */
  /* plot2 definition */
  /* plot3 definition */
  /* plot4 definition */
  /* plot5 definition */
endlayout;
Note that by adding
gutters, you do not increase the size of the graph. Instead, the cells
shrink to accommodate the gutters. Depending on the number of cells
in the grid and the size of the gutters, you will frequently want
to adjust the size of the graph to obtain optimal results, especially
if the cells contain complex graphs. For more information, see Adjusting the Graph Size.
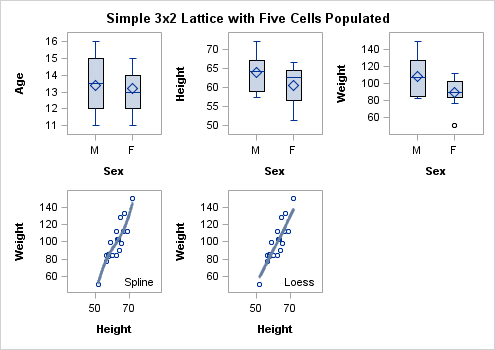
Defining Cells
entrytitle "Simple 3x2 Lattice with Five Cells Populated";
layout lattice / columns=3 rows=2 columngutter=10 rowgutter=10;

  /* stand-alone plot statements define cells 1-3 */
  boxplot x=sex y=age;
  boxplot x=sex y=height;
  boxplot x=sex y=weight;

  /* overlay blocks define cells 4-5 */
  layout overlay;
    scatterplot y=weight x=height;
    pbsplineplot y=weight x=height;
    entry halign=right "Spline" / valign=bottom;
  endlayout;

  layout overlay;
    scatterplot y=weight x=height;
    loessplot y=weight x=height;
    entry halign=right "Loess " / valign=bottom;
  endlayout;

endlayout;
Adding Cell Headers
To add cell headers
to the grid, you must specify a CELL block that contains a nested
CELLHEADER block. The CELLHEADER block can contain one or more ENTRY
statements, or it can contain other statements (DISCRETELEGEND, for
example).
entrytitle "Simple 3x1 Lattice with Cell Headers";
layout lattice / columns=3 rows=1;

  /* cell blocks cells 1-3 */
     cell;
       cellheader;
         entry "Spline Fit";
       endcellheader;
       layout overlay;
         scatterplot y=weight x=height;
         pbsplineplot y=weight x=height;
       endlayout;
     endcell;

     cell;
       cellheader;
         entry "Loess Fit";
       endcellheader;
       layout overlay;
         scatterplot y=weight x=height;
         loessplot y=weight x=height;
       endlayout;
     endcell;

     cell;
       cellheader;
         entry "Regression Fit";
       endcellheader;
       layout overlay;
         scatterplot y=weight x=height;
         regressionplot y=weight x=height;
       endlayout;
     endcell;
endlayout;
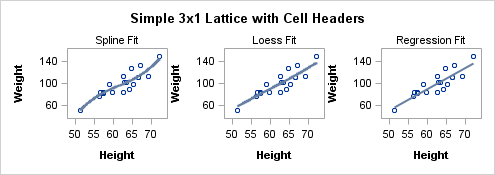
Because the GRIDDED
layout fills the cell header space above the plot wall, its border
aligns nicely with the plot.
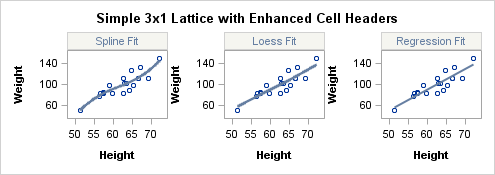
You can further enhance
the cell header by making the GRIDDED layout's background opaque and
setting a background color for it. To ensure that the color remains
coordinated with the current style, you could choose any of several
style elements that define light background colors, such as GraphHeaderBackground,
GraphBlock, or GraphAltBlock. Note that several style definitions
set the GraphHeaderBackground color to be the same as the GraphBackground
color. For styles like LISTING and JOURNAL, the background is white.
As a final enhancement,
you could coordinate the text color for the cell headers with a visual
attribute in the plot. For example, if you are displaying a fit plot
in the cell, you could set the text color to match the color of the
fit line. The TEXTATTRS= option in the ENTRY statement can be used
to set the text properties. The default settings for TEXTATTRS= are
derived from the GraphValueText style element. For more information
about ENTRY statements, see Adding and Changing Text in a Graph.
The following code enhances
the cell header block of the first cell. Similar code would be used
to enhance the header blocks of the other two cells:
cellheader;
  layout gridded / border=true opaque=true
                   backgroundcolor=GraphAltBlock:color;
    entry "Spline Fit" / textattrs=(color=GraphFit:contrastColor);
  endlayout;
endcellheader;
If you have a lengthy
text description to add to a cell header, you should use multiple
ENTRY statements to break the text into small segments. Otherwise,
the text might be truncated. Also, for a given row, if the number
of lines of text in the cell headers varies, a uniform cell height
is maintained across the row by setting all the row headers to the
height needed by the largest cell header.