Adjusting the Graph Size
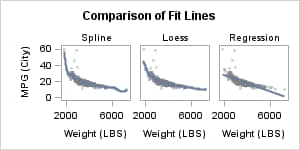
When defining the lattice
grid size, you generally have some idea of a good overall aspect ratio
for the graph. For example, if you are creating a one row by three
column grid, the graph has a default aspect ratio of 4:3. It would
look something like this:
The graph would look better if the graph's height were
smaller in relation to its width. You can establish a good default
graph size in the template definition by setting the DESIGNWIDTH=
and DESIGNHEIGHT= options in the BEGINGRAPH statement. After some
experimentation, you might decide that a 2:1 aspect ratio looks good:
begingraph / designwidth=400px designheight=200px ;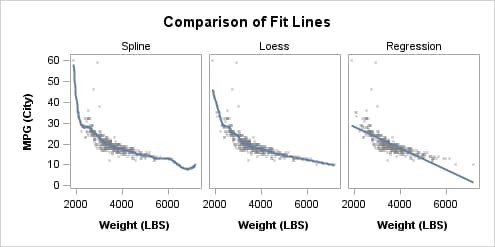
The DESIGNWIDTH= and DESIGNHEIGHT= options set the graph size as
part of the template definition so that if you later want a larger
or smaller version of this graph, you can use the ODS GRAPHICS statement
rather than resetting the design size and recompiling the template.
You need only specify either a WIDTH= or a HEIGHT= option in the ODS
GRAPHICS statement. The other dimension is automatically computed
for you, based on the aspect ratio that is specified in the compiled
template by the DESIGNWIDTH= and DESIGNHEIGHT= options.