The LAYOUT LATTICE Statement
The LAYOUT LATTICE statement
defines a multi-cell grid of graphs that can automatically align plot
areas and tick display areas across grid cells to facilitate data
comparisons among plots. The LATTICE layout differs from the classification
panel layouts in that the number of cells must be predefined and that
you must define the content of each cell separately. LATTICE is superficially
similar to a GRIDDED layout because it can create a grid of heterogeneous
plots. However, the LATTICE has much more functionality and supports
the following:
LATTICE Layout with Internal Axes shows a four-cell grid (two rows
and two columns). It was produced with a LATTICE layout to illustrate
the features of this layout type. The figure contains definitions
of four plots, which by default are treated independently.
A mixture of plot types
or nested layouts could be used in the cells of the lattice. By default,
each plot manages its own axes internal to the lattice boundaries.
In the figure, a light gray border has been added to each plot to
show its boundaries within the lattice. The shaded areas represent
the optional features that you can add to the lattice definition.
By default, these shaded areas are not used in the lattice and space
is not reserved for them. Thus, in the default case, the plot areas
would expand to replace the shaded areas in the cells.
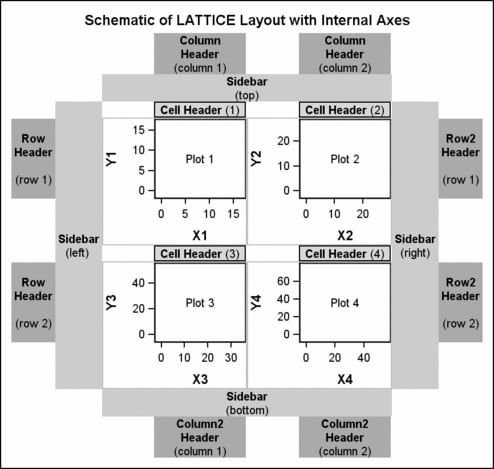
The shaded areas that
are shown in the figure are typically used as follows:
-
Cell Headers are commonly used to describe the contents of a cell. Notice that the cell header, when present, has a separate space above the plot wall area. The cell header can contain more than one line of text, but it is not restricted to displaying text. For example, you could use this area to display a legend.
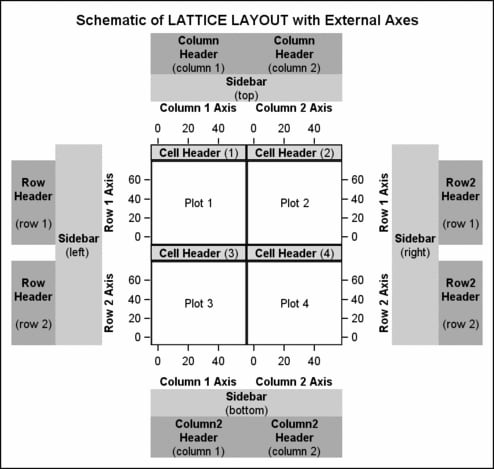
LATTICE Layout with External Axes shows how the lattice would look
if you used additional options to externalize the axes. The figure
externalizes both the row and column axes, but you could externalize
the axes only for the rows, or only for the columns. When axes are
external to the cells, the scale of the data ranges that are displayed
for the plots are always unified in some form. Unifying the scale
of the data ranges means taking the minimum of all data minima and
the maximum of all data maxima from a set of plots. The following
variations are available for unifying the axes:
-
the scale of the data ranges of all X-axes in a column can be unified on a per-column basis, or unified across all columns. (See "Column 1 Axis" and "Column 2 Axis" in LATTICE Layout with External Axes.)
-
the scale of the data ranges of all Y-axes in a row can be unified on a per-row basis, or unified across all rows. (See "Row 1 Axis" and "Row 2 Axis" in LATTICE Layout with External Axes.)
By default, external
axes are displayed only on the primary axes (bottom and left). They
are not displayed on the secondary axes (top and right) unless requested.
Notice that external axes use less space and result in larger plot
areas than internal axes. (Compare LATTICE Layout with External Axes with LATTICE Layout with Internal Axes, which is the
same size.)
proc template;
  define statgraph intro;
    begingraph;
      entrytitle "Two-Cell Lattice Layout";
      layout lattice;
        barchart x=age;
        scatterplot x=height y=weight;
      endlayout;
    endgraph;
  end;
run;

proc sgrender data=sashelp.class template=intro;
run;
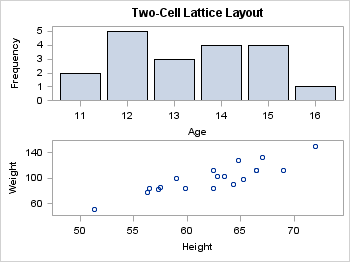
In a LATTICE layout,
each plot statement is considered independent and is placed in a separate
cell. When no grid size is provided, the default layout creates a
graph with one column of cells, and it allots each cell the same amount
of space. The number of rows in the grid is determined by the number
of stand-alone plot statements in the layout block.