Creating Uniform Axes across Rows or Columns
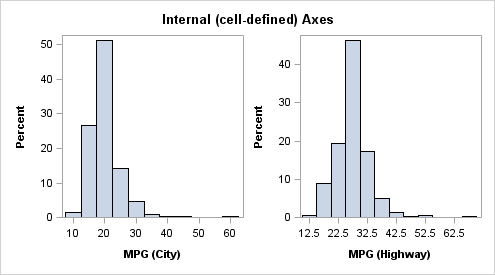
Internal Axes
By default, the plots
in the cells of the LATTICE layout manage their own axes, as demonstrated
by the following example:
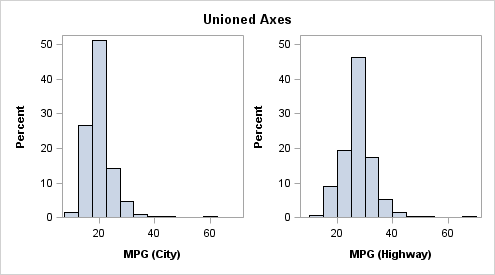
Uniform Axis Ranges
To set a uniform scale
on the X axis in each row of a lattice, use the COLUMNDATARANGE= option
on the LAYOUT LATTICE statement. Likewise, to set a uniform scale
on the Y axis in each row of the lattice, use the ROWDATARANGE= option.
These options accept one of the following values:
layout lattice / columns=2 columngutter=5px
                 columdatarange=unionall
                 rowdatarange=union ;
  histogram mpg_city;
  histogram mpg_highway;
endlayout;
Note: The default X-axis for a
histogram shows ticks at bin midpoints or bin start and end points.
If the histograms happen to have the same bin width, it is possible
to create uniformly scaled X axes. However, when the bin widths are
different, there might not be any common midpoints. To handle this
situation, the LATTICE layout automatically switches to a LINEAR type
axis so that the axis tick values can be uniform, even though they
might not be at bin midpoints or boundaries for all histograms.
Some restrictions
apply to the UNION and UNIONALL settings on any row or column of the
lattice:
-
if you create a multipanel lattice with ROWDATARANGE=UNION in effect, the axis range for each row might differ from panel to panel. The ROWDATARANGE=UNION option does not extend across panels, which means the axis range is computed on a per-row basis for each panel rather than across all of the panels.
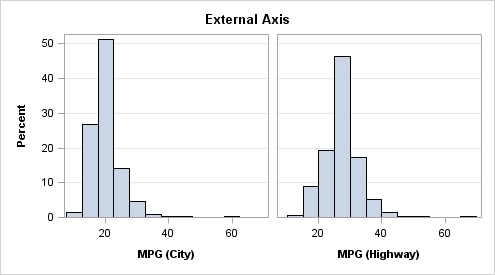
External Axes
Specifying External Axes
Whenever axis scales
have been unified for a row or a column, you can replace the individual
cell axes in that row or column with a single axis that is external
to the cells.
To externalize the X axis,
use the following syntax:
COLUMNAXES;
COLUMNAXIS / options ;
<COLUMNAXIS / options ;>
ENDCOLUMNAXES;
To externalize the Y axis,
use the following syntax:
ROWAXES;
ROWAXIS / options ;
<ROWAXIS / options ;>
ENDROWAXES;
Within the axes blocks,
you should specify as many COLUMNAXIS or ROWAXIS statements as there
are columns or rows in the grid. The options that are available to each statement are similar to those that are
available for the XAXISOPTS= and YAXISOPTS= options of a LAYOUT OVERLAY
statement. The options that
you specify can differ from statement to statement.
Note: When a row or column external
axis is used, all axis options on the internal axes in that same dimension
are ignored.
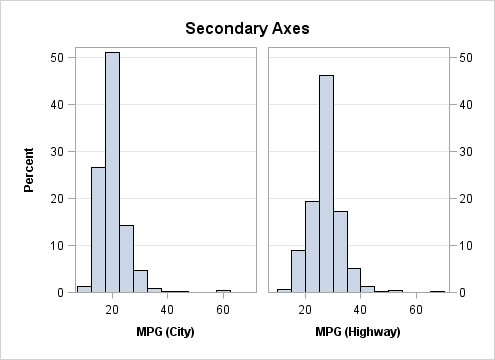
Displaying External Secondary Axes
The DISPLAYSECONDARY=
option can be used on a ROWAXIS statement to display a row axis at
the right of the lattice. It can be used on a COLUMNAXIS statement
to display a column axis at the top of the lattice. These external
secondary axes are duplicates of the external primary axis and are
not truly independent axes. However, you can change the features that
are displayed on the secondary axis. In the following example, the
ticks and tick values are repeated on the right side of the lattice,
but the axis label is suppressed by not listing it among the features
that are requested on the DISPLAYSECONDARY= option.
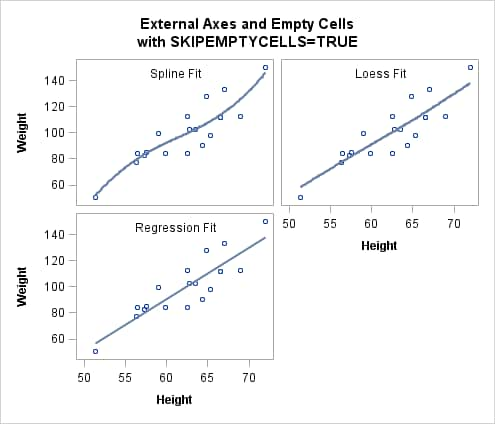
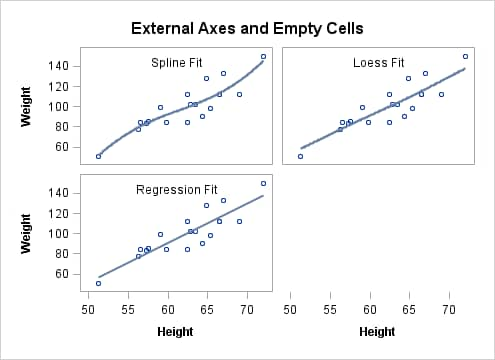
External Axes and Empty Cells
If a LATTICE layout
generates empty cells and there are external axes, a row or column
axis might be displayed near one or more of those empty cells. The
following example shows the default case:
layout lattice / columns=2 rows=2
  rowgutter=5px columngutter=5px
  rowdatarange=unionall columndatarange=unionall;

  /* overlay blocks define cells 1-3 */
  layout overlay;
    entry "Spline Fit" / valign=top;
    scatterplot y=weight x=height;
    pbsplineplot y=weight x=height;
  endlayout;
  layout overlay;
    entry "Loess Fit" / valign=top;
    scatterplot y=weight x=height;
    loessplot y=weight x=height;
  endlayout;
  layout overlay;
    entry "Regression Fit" / valign=top;
    scatterplot y=weight x=height;
    regressionplot y=weight x=height;
  endlayout;

  rowaxes;
    rowaxis;
    rowaxis;
  endrowaxes;
  columnaxes;
    columnaxis;
    columnaxis;
  endcolumnaxes;
endlayout;
Adding the SKIPEMPTYCELLS=TRUE setting to the LAYOUT
LATTICE statement eliminates the space that is normally reserved for
the empty cells. In that case, an external axis that might have been
displayed near an empty cell is displayed near a populated cell instead:
layout lattice / columns=2 rows=2
  rowgutter=5px columngutter=5px
  rowdatarange=unionall columndatarange=unionall
  skipemptycells=true ;