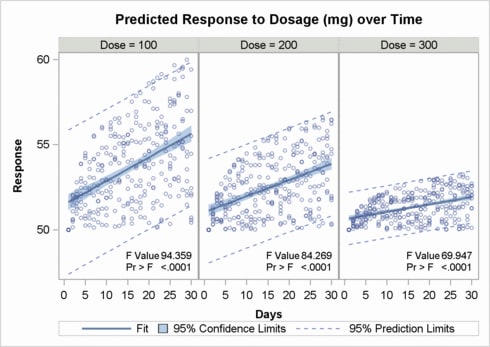
Adding an Inset to Each Cell
You can define a unique
inset for each cell of the classification panel with the INSET= and
INSETOPTS= options. The following graph builds on the last example
by adding insets:
proc template;
define statgraph panelinset;
 begingraph / designwidth=495px designheight=350px;
  layout datapanel classvars=(dose) / rows=1
         inset=(F PROB)
         insetopts=(textattrs=(size=7pt) halign=right valign=bottom) ;
    layout prototype;
      bandplot    x=days limitupper=uclm limitlower=lclm / name="clm"
                    display=(fill)  fillattrs=GraphConfidence
                    legendlabel="95% Confidence Limits";
      bandplot    x=days limitupper=ucl limitlower=lcl / name="cli"
                    display=(outline) outlineattrs=GraphPredictionLimits
                    legendlabel="95% Prediction Limits";
      seriesplot  x=days y=predicted / name="reg"
                    lineattrs=graphFit legendlabel="Fit";
      scatterplot x=days y=response /	 primary=true
                    markerattrs=(size=5px) datatransparency=.5;
    endlayout;
    sidebar / align=top;
      entry  "Predicted Response to Dosage (mg) over Time" /
              textattrs=GraphTitleText pad=(bottom=10px);
    endsidebar;
    sidebar / align=bottom;
      discretelegend "reg" "clm" "cli" / across=3;
    endsidebar;
  endlayout;
 endgraph;
end;
run;

data trial;
 do Dose = 100 to 300 by 100;
  do Days=1 to 30;
   do Subject=1 to 10;
   Response=log(days)*(400-dose)* .01*ranuni(1) + 50;
   output;
   end;
  end;
 end;
run;

proc glm data=trial alpha=.05 noprint outstat=outstat ;
 by dose;
 model response=days / p cli clm;
 output out=stats
        lclm=lclm uclm=uclm lcl=lcl ucl=ucl predicted=predicted;
run; quit;

data inset;
  set outstat (keep=F PROB _TYPE_ where=(_TYPE_="SS1"));
  label F="F Value " PROB="Pr > F ";
  format F best6. PROB pvalue6.4;
run;

data stats2;
  merge stats inset;
run;

ods html style=statistical;

proc sgrender data=stats2 template=panelinset;
run;
Adding Insets to Classification Panels discusses this topic in detail and shows the coding for
another example in which the inset information must align correctly
in a multi-row and multi-column classification panel.