Using PROC SGPANEL to Create Classification Panels
When creating a panel
like the one shown in Using Non-computed Plots in Classification Panels, you might
find it easier to create the panel by using PROC SGPANEL in SAS because
the procedure does all the necessary data computations for you. For
example, the REGRESSIONPLOT, LOESSPLOT, and PBSPLINEPLOT statements
have been incorporated into the SGPANEL procedure as REG, LOESS, and
PBSPLINE statements. (SGPANEL can also generate other plot types.)
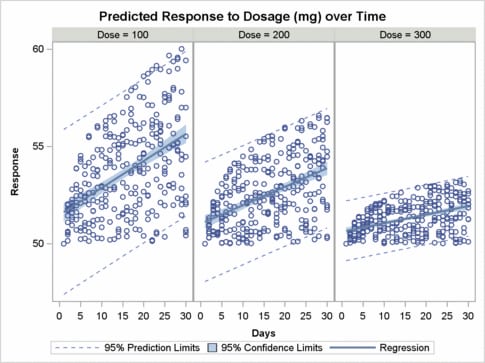
By default on PROC SGPANEL, the PANELBY statement creates a DATAPANEL
layout.
ods html style=statistical;

title "Predicted Response to Dosage (mg) over Time";
proc sgpanel data=trial;
  panelby dose / rows=1;
  reg x=days y=response / cli clm;
run;
Most, but not all, features
of the DATALATTICE and DATAPANEL layouts are provided in the SGPANEL
procedure.
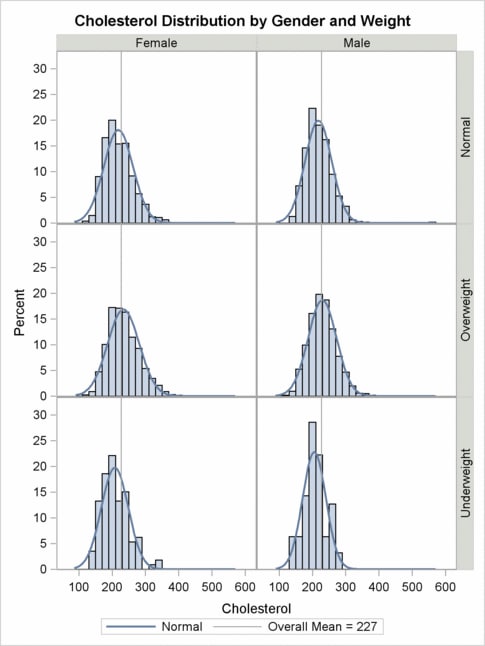
The SGPANEL procedure
supports computed plot statements such as HISTOGRAM, DENSITY, DOT,
VBOX, and HBOX (vertical and horizontal box plots). The PANELBY statement
controls the layout, determining whether a DATAPANEL, DATALATTICE,
or other layout is used to produce the graph. ROWAXIS and COLAXIS
statements control the external axes, and the KEYLEGEND statement
creates legends, which are placed in sidebars for you.
The SGPANEL procedure
does not have a PROTOTYPE block because all of the plot statements
after PANELBY are considered part of the prototype. The SGPANEL procedure
generates GTL template code behind the scenes and executes the template
to create its output. See the SAS ODS Graphics: Procedures Guide for details.
ods html style=statistical;

title "Cholesterol Distribution by Gender and Weight";
proc sgpanel data=sashelp.heart;
  panelby sex weight_status /  layout=lattice onepanel novarname;
  histogram cholesterol;
  density cholesterol / name="density";
  refline 227 / axis=x name="ref" legendlabel="Overall Mean = 227";
  rowaxis  offsetmin=0 offsetmax=.1 max=30;
  keylegend  "density" "ref";
run;