SGPLOT Procedure
- Syntax
 Procedure SyntaxPROC SGPLOT StatementBAND StatementBUBBLE StatementDENSITY StatementDOT StatementELLIPSE StatementHBAR StatementHBARPARM StatementHBOX StatementHIGHLOW StatementHISTOGRAM StatementHLINE StatementINSET StatementKEYLEGEND StatementLINEPARM StatementLOESS StatementNEEDLE StatementPBSPLINE StatementREFLINE StatementREG StatementSCATTER StatementSERIES StatementSTEP StatementVBAR StatementVBARPARM StatementVBOX StatementVECTOR StatementVLINE StatementWATERFALL (Preproduction) StatementXAXIS StatementX2AXIS StatementYAXIS StatementY2AXIS Statement
 - Overview
- Concepts
- Examples Grouping a Scatter PlotClustering a Grouped Scatter Plot Plotting Three SeriesAdding Prediction and Confidence Bands to a Regression PlotAdding a Prediction Ellipse to a Scatter PlotCreating Lines and Bands from Pre-Computed DataAdding Statistical Limits to a Dot PlotCombining Histograms with Density PlotsCreating a Horizontal Box PlotCreating a Bar-Line ChartCreating a High-Low Chart
STEP Statement
Creates a step plot.
| Restriction: | The vertical axis that is used with the STEP statement cannot be a discrete axis. |
| Example: | About Step Plots |
Syntax
STEP X= variable Y= numeric-variable < /
option(s)>;
Summary of Optional Arguments
Group options
specifies the width of the group clusters as a fraction
of the midpoint spacing.
specifies a variable that is used to group the data.
specifies how to display grouped step lines.
specifies the ordering of step lines within a group.
specifies that missing values of the group variable
are not included in the plot.
Label options
adds a label for the curve.
specifies the appearance of the labels in the plot
when you use the CURVELABEL= option.
specifies whether the curve label is placed inside
the plot axes (INSIDE) or outside of the plot axes (OUTSIDE).
specifies the location of the curve label.
displays a label for each data point.
specifies the appearance of the labels in the plot
when you use the DATALABEL= option.
Marker options
specifies the appearance of the markers in the plot.
adds markers to the step plot data points.
Plot options
specifies the value of the ID variable in an attribute
map data set.
specifies a label that identifies the step plot
in the legend.
specifies a name for the plot.
specifies the degree of transparency for the lines.
specifies a character variable that contains URLs
for Web pages to be displayed when parts of the plot are selected
within an HTML page.
assigns the X variable to the secondary (top) horizontal
axis.
assigns the Y variable to the secondary (right)
vertical axis.
Step options
creates a break in the line for each missing value
for the Y variable.
specifies an amount to offset all step lines from
discrete X values.
specifies the appearance of the error bars in the
plot.
specifies the location of each step relative to
its data point.
specifies the appearance of the step line.
specifies a variable that contains the lower endpoints
for the Y error bars.
specifies a variable that contains the upper endpoints
for the Y error bars.
Optional Arguments
- ATTRID= variable
- specifies the value of the ID variable in an attribute map data set. You specify this option only if you are using an attribute map to control visual attributes of the graph. For more information, see Using SG Attribute Maps to Control Visual Attributes.
- CLUSTERWIDTH= numeric-value
- specifies the width of the group clusters as a fraction
of the midpoint spacing. Specify a value from
0.0 (narrowest) to 1.0 (widest).Default:0.8Interaction:This option is applicable only when the GROUP option is specified, when GROUPDISPLAY=CLUSTER, and when the category axis is discrete.
- CURVELABEL <=“text-string”>
- adds a label for the curve. You can also specify the label text. If you do not specify a label, the label from the Y variable is used.
- CURVELABELATTRS= style-element <(options)> | (options)
- specifies the appearance of the labels in the plot
when you use the CURVELABEL= option. You can specify the
appearance by using a style element or by using suboptions. If you
specify a style element, you can also specify suboptions to override
specific appearance attributes.
- COLOR= color
-
specifies the color of the label characters. You can specify colors using the same color schemes that are supported by
SAS/GRAPH software. For more information, see Color-Naming Schemes in SAS/GRAPH: Reference.Default:For ungrouped data, the default color is specified by the Color attribute of the GraphValueText style element in the current style. For grouped data, the default color is specified by the ContrastColor attribute of the GraphData1 ... GraphDatan style elements in the current style.
- FAMILY= “font-family”
-
specifies the font family for the label characters. The SAS ODS styles use TrueType system fonts. For more information, see TrueType Fonts Supplied by SAS in SAS Language Reference: Concepts.Default:The default font family is specified by the FontFamily attribute of the GraphValueText style element in the current style.Restriction:You cannot specify a list of font family names.
- SIZE= n <units>
-
specifies the font size of the label characters. You can also specify the unit of measurement. The default unit is pixels. For a list of measurement units that are supported, see Units of Measurement.Default:The default font size is specified by the FontSize attribute of the GraphValueText style element in the current style.
- STYLE= ITALIC | NORMAL
-
specifies whether the label characters are italic or normal.Default:The default font style is specified by the FontStyle attribute of the GraphValueText style element in the current style.
- WEIGHT= BOLD | NORMAL
-
specifies whether the label characters are bold or normal.Default:The default font weight is specified by the FontWeight attribute of the GraphValueText style element in the current style.
Here is an example expression:CURVELABELATTRS=(Color=Green Family=Arial Size=8 Style=Italic Weight=Bold)
Default:The default style element is GraphValueText.Interaction:This option has no effect unless the CURVELABEL option is also specified.
- CURVELABELLOC= OUTSIDE | INSIDE
- specifies whether the curve label is placed inside
the plot axes (INSIDE) or outside of the plot axes (OUTSIDE). Default:INSIDE
- CURVELABELPOS= AUTO | END | MAX | MIN | START
- specifies the location of the curve label. Specify one of the
following values:
- AUTO
-
places the curve label outside the plot area near the end of the curve along unused axes whenever possible (typically Y2 or X2).Interaction:This value takes effect only when CURVELABELLOC=OUTSIDE.
Default:ENDInteractions:This option has no effect unless the CURVELABEL option is also specified.The START and END suboptions take effect only when CURVELABELLOC=INSIDE.
- DATALABEL <= variable>
- displays a label for each data point. If you specify a variable, the values of that variable are used for the data labels. If you do not specify a variable, then the values of the Y variable are used for the data labels.
- DATALABELATTRS= style-element <(options)> | (options)
- specifies the appearance of the labels in the plot
when you use the DATALABEL= option. You can specify the
appearance by using a style element or by using suboptions. If you
specify a style element, you can also specify suboptions to override
specific appearance attributes.
- COLOR= color
-
specifies the color of the label characters. You can specify colors using the same color schemes that are supported by
SAS/GRAPH software. For more information, see Color-Naming Schemes in SAS/GRAPH: Reference.Default:For ungrouped data, the default color is specified by the Color attribute of the GraphDataText style element in the current style. For grouped data, the default color is specified by the ContrastColor attribute of the GraphData1 ... GraphDatan style elements in the current style.
- FAMILY= “font-family”
-
specifies the font family for the label characters. The SAS ODS styles use TrueType system fonts. For more information, see TrueType Fonts Supplied by SAS in SAS Language Reference: Concepts.Default:The default font family is specified by the FontFamily attribute of the GraphDataText style element in the current style.
- SIZE= n <units>
-
specifies the font size of the label characters. You can also specify the unit of measurement. The default unit is pixels. For a list of measurement units that are supported, see Units of Measurement.Default:The default font size is specified by the FontSize attribute of the GraphDataText style element in the current style.
- STYLE= ITALIC | NORMAL
-
specifies whether the label characters are italic (ITALIC) or normal (NORMAL).Default:The default font style is specified by the FontStyle attribute of the GraphDataText style element in the current style.
- WEIGHT= BOLD | NORMAL
-
specifies whether the label characters are bold (BOLD) or normal (NORMAL).Default:The default font weight is specified by the FontWeight attribute of the GraphDataText style element in the current style.
Here is an example expression:DATALABELATTRS=(Color=Green Family=Arial Size=8 Style=Italic Weight=Bold)
Default:The default style element is GraphDataText.Interaction:This option has no effect unless the DATALABEL option is also specified.
- DISCRETEOFFSET= numeric-value
- specifies an amount to offset all step lines from
discrete X values. Specify a value from
-0.5 (left offset) to +0.5 (right offset).Default:0.0 (no offset)Requirement:This option is applicable only when the X axis is discrete.
- ERRORBARATTRS= style-element <(options)> | (options)
- specifies the appearance of the error bars in the
plot. You can specify the
appearance by using a style element or by using suboptions. If you
specify a style element, you can also specify suboptions to override
specific appearance attributes.
- COLOR= color
-
specifies the color of the line. You can specify colors using the same color schemes that are supported by
SAS/GRAPH software. For more information, see Color-Naming Schemes in SAS/GRAPH: Reference.Default:The default color is specified by the ContrastColor attribute of the GraphError style element in the current style.
- PATTERN= line-pattern
-
specifies the line pattern for the line. You can reference SAS patterns by number or by name. For a list of line patterns, see Line Patterns.Default:The default line pattern is specified by the LineStyle attribute of the GraphError style element in the current style.
- THICKNESS= n <units>
-
specifies the thickness of the line. You can also specify the unit of measure. The default unit is pixels. For a list of measurement units that are supported, see Units of Measurement.Default:The default line thickness is specified by the LineThickness attribute of the GraphError style element in the current style.
- GROUP= variable
- specifies a variable that is used to group the data. The plot elements for each group value are automatically distinguished by different visual attributes.
- GROUPDISPLAY= CLUSTER | OVERLAY
- specifies how to display grouped step lines.
- OVERLAY
-
grouped items are drawn at the exact coordinate and might overlap. Each group is represented by unique visual attributes derived from the GraphData1... GraphDatan style elements in the current style.
Default:OVERLAYRestriction:GROUPDISPLAY=CLUSTER can take effect only when the category axis is discrete. If necessary, use a TYPE=DISCRETE option on the axis statement.Interaction:This option is ignored unless GROUP= is specified.
- GROUPORDER= ASCENDING | DESCENDING | DATA
- specifies the ordering of step lines within a group.
Interaction:This option is ignored unless GROUP= is specified.
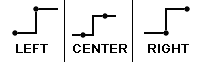
- JUSTIFY= LEFT | CENTER | RIGHT
- specifies the location of each step relative to its data point. Values for JUSTIFY= shows the effect of each option:
- LEGENDLABEL= “text-string”
- specifies a label that identifies the step plot in the legend. By default, the label of the Y variable or the group value for each marker is used.
- LINEATTRS= style-element <(options)> | (options)
- specifies the appearance of the step line. You can specify the
appearance by using a style element or by using suboptions. If you
specify a style element, you can also specify suboptions to override
specific appearance attributes.
- COLOR= color
-
specifies the color of the line. You can specify colors using the same color schemes that are supported by
SAS/GRAPH software. For more information, see Color-Naming Schemes in SAS/GRAPH: Reference.Default:For ungrouped data, the default color is specified by the ContrastColor attribute of the GraphDataDefault style element in the current style. For grouped data, the default color is specified by the ContrastColor attribute of the GraphData1 ... GraphDatan style elements in the current style.
- PATTERN= line-pattern
-
specifies the line pattern for the line. You can reference SAS patterns by number or by name. For a list of line patterns, see Line Patterns.Default:For ungrouped data, the default line pattern is specified by the LineStyle attribute of the GraphDataDefault style element in the current style. For grouped data, the default line pattern is specified by the LineStyle attribute of the GraphData1 ... GraphDatan style elements in the current style.
- THICKNESS= n <units>
-
specifies the thickness of the line. You can also specify the unit of measure. The default unit is pixels. For a list of measurement units that are supported, see Units of Measurement.Default:For ungrouped data, the default line thickness is specified by the LineThickness attribute of the GraphDataDefault style element in the current style. For grouped data, the default line thickness is specified by the LineThickness attribute of the GraphData1 ... GraphDatan style elements in the current style.
- MARKERATTRS= style-element <(options)> | (options)
- specifies the appearance of the markers in the plot. This option has no
effect unless you also specify the MARKERS option. You can specify
the appearance by using a style element or by using suboptions. If
you specify a style element, you can also specify suboptions to override
specific appearance attributes.
- COLOR= color
-
specifies the color of the markers. You can specify colors using the same color schemes that are supported by
SAS/GRAPH software. For more information, see Color-Naming Schemes in SAS/GRAPH: Reference.Default:For ungrouped data, the default color is specified by the ContrastColor attribute of the GraphDataDefault style element in the current style. For grouped data, the default color is specified by the ContrastColor attribute of the GraphData1 ... GraphDatan style elements in the current style.
- SIZE= n <units>
-
specifies the size of the markers. You can also specify the unit of measurement. The default unit is pixels. For a list of measurement units that are supported, see Units of Measurement.Default:The default marker size is specified by the MarkerSize attribute of the GraphDataDefault style element in the current style.
- SYMBOL= symbol-name
-
specifies the symbol for the markers. For a list of valid marker symbols, see Marker Symbols.Default:For ungrouped data, the default marker symbol is specified by the MarkerSymbol attribute of the GraphDataDefault style element in the current style. For grouped data, the default marker symbol is specified by the MarkerSymbol attribute of the GraphData1 ... GraphDatan style elements in the current style.
- NAME= “text-string”
- specifies a name for the plot. You can use the name
to refer to this plot in other statements.Note:The name is case-sensitive. When you refer to the specified name in other statements, you must use the same exact capitalization.
- NOMISSINGGROUP
- specifies that missing values of the group variable
are not included in the plot. Interaction:This option has no effect unless GROUP= is also specified.
- TRANSPARENCY= numeric-value
- specifies the degree of transparency for the lines. Specify a value from
0.0 (completely opaque) to 1.0 (completely transparent).Default:0.0
- URL= character-variable
- specifies a character variable that contains URLs
for Web pages to be displayed when parts of the plot are selected
within an HTML page. Default:By default, no HTML links are created.Interactions:This option affects graphics output that is created through the ODS HTML destination only. For more information about ODS destinations, see Specifying a Destination.
This option has no effect unless you also specify IMAGEMAP in the ODS GRAPHICS statement. For more information, see Using the ODS GRAPHICS Statement.
- YERRORLOWER= numeric-variable
- specifies a variable that contains the lower endpoints for the Y error bars.