SGPLOT Procedure
- Syntax
 Procedure SyntaxPROC SGPLOT StatementBAND StatementBUBBLE StatementDENSITY StatementDOT StatementELLIPSE StatementHBAR StatementHBARPARM StatementHBOX StatementHIGHLOW StatementHISTOGRAM StatementHLINE StatementINSET StatementKEYLEGEND StatementLINEPARM StatementLOESS StatementNEEDLE StatementPBSPLINE StatementREFLINE StatementREG StatementSCATTER StatementSERIES StatementSTEP StatementVBAR StatementVBARPARM StatementVBOX StatementVECTOR StatementVLINE StatementWATERFALL (Preproduction) StatementXAXIS StatementX2AXIS StatementYAXIS StatementY2AXIS Statement
 - Overview
- Concepts
- Examples Grouping a Scatter PlotClustering a Grouped Scatter Plot Plotting Three SeriesAdding Prediction and Confidence Bands to a Regression PlotAdding a Prediction Ellipse to a Scatter PlotCreating Lines and Bands from Pre-Computed DataAdding Statistical Limits to a Dot PlotCombining Histograms with Density PlotsCreating a Horizontal Box PlotCreating a Bar-Line ChartCreating a High-Low Chart
KEYLEGEND Statement
Adds a legend to the plot.
| Examples: | Adding a Prediction Ellipse to a Scatter PlotCreating Lines and Bands from Pre-Computed DataCombining Histograms with Density Plots |
Syntax
KEYLEGEND <“name–1”
... “name-n”> </ option(s)>;
Summary of Optional Arguments
Legend options
specifies the number of columns in the legend.
specifies whether the border around the legend is
visible.
specifies the number of rows in the legend.
specifies whether the legend is placed outside or
inside of the axis area.
specifies the position of the legend within the
graph.
specifies the appearance of the legend value labels.
specifies the names of one or more plots that you
want to include in legend.
Title options
specifies a title for the legend.
specifies the appearance of the title.
Optional Arguments
- “name-1” ... “name-n”
- specifies the names of one or more plots that you want to include in legend. Each name that you specify must correspond to a value that you entered for the NAME= option in a plot statement.
- ACROSS= n
- specifies the number of columns in the legend. By default, the number
of columns is determined automatically.Note:Depending on the number of legend entries and the number of columns and rows that you specify, the legend might not fit in your graph. If your legend does not appear, then you might need to specify a different value for the ACROSS= option.
- BORDER | NOBORDER
- specifies whether the border around the legend is
visible. The BORDER option shows
the border. The NOBORDER option hides the border.Default:BORDER
- DOWN= n
- specifies the number of rows in the legend. By default, the number of rows is determined automatically.
- LOCATION= OUTSIDE | INSIDE
- specifies whether the legend is placed outside or
inside of the axis area. The OUTSIDE option
places the legend outside of the axis area. The INSIDE option places
the legend inside of the axis area.Default:OUTSIDEInteraction:If LOCATION=INSIDE and POSITION= is also specified with any value, you might need to offset the axis in order to make space for the legend within the axis area. For more information, see Legend with a Position Specified inside the Axis Area.
- POSITION= position-value
- specifies the position of the legend within the
graph. The positions are as
follows:
Default:BOTTOM
If LOCATION=INSIDE is specified, the legend is automatically positioned near an edge of the plot area that has the least amount of collision with the data.
Interaction:If LOCATION=INSIDE and POSITION= is also specified with any value, you might need to offset the axis in order to make space for the legend within the axis area. For more information, see Legend with a Position Specified inside the Axis Area.Notes:By default, if you use more than one KEYLEGEND statement, then each legend is placed in a different position.If you specify more than one legend with the same position, then all of your legends are placed at that position.
- TITLEATTRS= style-element <(options)> | (options)
- specifies the appearance of the title. You can specify the
appearance by using a style element or by using suboptions. If you
specify a style element, you can also specify suboptions to override
specific appearance attributes.
- COLOR= color
-
specifies the color of the title characters. You can specify colors using the same color schemes that are supported by
SAS/GRAPH software. For more information, see Color-Naming Schemes in SAS/GRAPH: Reference.Default:For ungrouped data, the default color is specified by the Color attribute of the GraphLabelText style element in the current style. For grouped data, the default color is specified by the ContrastColor attribute of the GraphData1 ... GraphDatan style elements in the current style.
- FAMILY= “font-family”
-
specifies the font family for the title characters. The SAS ODS styles use TrueType system fonts. For more information, see TrueType Fonts Supplied by SAS in SAS Language Reference: Concepts.Default:The default font family is specified by the FontFamily attribute of the GraphLabelText style element in the current style.Restriction:You cannot specify a list of font family names.
- SIZE= n <units>
-
specifies the font size of the title characters. You can also specify the unit of measurement. The default unit is pixels. For a list of measurement units that are supported, see Units of Measurement.Default:The default font size is specified by the FontSize attribute of the GraphLabelText style element in the current style.
- STYLE= ITALIC | NORMAL
-
specifies whether the title characters are italic or normal.Default:The default font style is specified by the FontStyle attribute of the GraphLabelText style element in the current style.
- WEIGHT= BOLD | NORMAL
-
specifies whether the title characters are bold or normal.Default:The default font weight is specified by the FontWeight attribute of the GraphLabelText style element in the current style.
Default:The default appearance of the title text is specified by the GraphLabelText style element in the current style.
- VALUEATTRS= style-element <(options)> | (options)
- specifies the appearance of the legend value labels. You can specify the
appearance by using a style element or by using suboptions. If you
specify a style element, you can also specify suboptions to override
specific appearance attributes.
- COLOR= color
-
specifies the color of the label characters. You can specify colors using the same color schemes that are supported by
SAS/GRAPH software. For more information, see Color-Naming Schemes in SAS/GRAPH: Reference.Default:For ungrouped data, the default color is specified by the Color attribute of the GraphValueText style element in the current style. For grouped data, the default color is specified by the ContrastColor attribute of the GraphData1 ... GraphDatan style elements in the current style.
- FAMILY= “font-family”
-
specifies the font family for the label characters. The SAS ODS styles use TrueType system fonts. For more information, see TrueType Fonts Supplied by SAS in SAS Language Reference: Concepts.Default:The default font family is specified by the FontFamily attribute of the GraphValueText style element in the current style.Restriction:You cannot specify a list of font family names.
- SIZE= n <units>
-
specifies the font size of the label characters. You can also specify the unit of measurement. The default unit is pixels. For a list of measurement units that are supported, see Units of Measurement.Default:The default font size is specified by the FontSize attribute of the GraphValueText style element in the current style.
Examples
Example 1: Legend for Two Ellipses
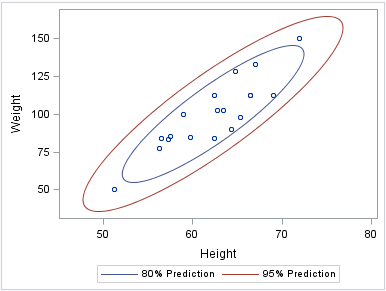
ods graphics / reset width=4in;
proc sgplot data=sashelp.class
      noautolegend;
  scatter x=height y=weight;
  ellipse x=height y=weight /
     alpha=.2
     name="eighty"
     legendlabel="80% Prediction";
  ellipse x=height y=weight /
     alpha=.05
     name="ninetyfive"
     legendlabel="95% Prediction";
  keylegend "eighty" "ninetyfive";
run;
Example 2: Legend with a Position Specified inside the Axis Area
If POSITION= and LOCATION=
INSIDE are both specified, you might need to offset the axis in order
to make space for the legend within the axis area.
The following example
specifies LOCATION= INSIDE and POSITION= BOTTOM. In the graph, the
legend collides with the data. To avoid this problem, the graph specifies
an OFFSETMIN= value for the Y axis. (If the legend’s position
was at the top of the plot, an OFFSETMAX= value would be specified
instead.)
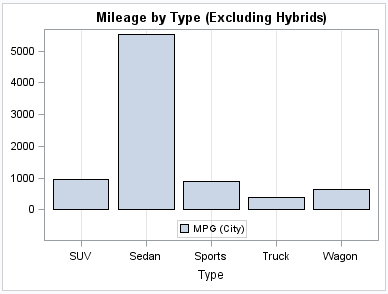
ods graphics / reset width=4in;
title "Mileage by Type (Excluding Hybrids)";
proc sgplot data=sashelp.cars;
  where type ne "Hybrid";
  vbar type / response=mpg_city;
  keylegend / location=inside position=bottom;
  xaxis grid;
  yaxis offsetmin=0.15 display=(nolabel);
run;
title;
Note: For HBOX, HBAR, HLINE, and
DOT plot statements, the Y axis is reversed by default, so the axis
origin is at the top. As a result, you use OFFSETMAX= to create an
offset at the bottom of the axis. OFFSETMIN= is used to create an
offset at the top of the axis for these plot types.