Using the ODS GRAPHICS Statement
Introduction
You can use the ODS
GRAPHICS statement options to control many aspects of your graphics.
The settings that you specify remain in effect for all graphics until
you change or reset these settings with another ODS GRAPHICS statement.
When you use the GTL
language or SAS ODS Graphics procedures in the SAS Windowing environment,
ODS GRAPHICS is ON by default. In batch mode, ODS GRAPHICS is OFF
by default.
ODS GRAPHICS < OFF
| ON> </ option(s)>;
Note: For
the complete statement syntax, see ODS GRAPHICS Statement in SAS Output Delivery System: User's Guide.
The following
program uses the ODS GRAPHICS statement to illustrate several techniques
for controlling your graphics.
Note: The following
sections provide only summary information. For
the complete information, see ODS GRAPHICS Statement in SAS Output Delivery System: User's Guide.
Controlling Graphics with the ODS GRAPHICS Statement
ods graphics on /
     width=3.25in
     outputfmt=gif
     imagemap=on
     imagename="MyBoxplot"
     border=off;

ods html file="Boxplot-Body.html" style=journal
gpath="C:\myfiles\images";

proc sgplot data=sashelp.heart;
  title "Cholesterol Distribution by Weight Class";
  hbox cholesterol / category=weight_status;
run;

ods html style=htmlblue;
ods graphics on / reset=all;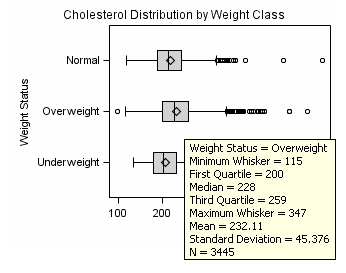
Controlling the Size of Your Graph
Overview
When modifying the size
of your graph, it is important to take into consideration the image
scaling and aspect ratio, as well as the width and height of the
graph. For example, rendering a graph to the LISTING destination at
the default design size and default DPI of 100, produces a graph that
is 640 by 480 pixels. If the same graph is rendered to the RTF destination,
which has a default DPI of 200, the graph size is closer to 1280 by
960 pixels. The graph is scaled using 96 DPI as a baseline (640 *
200 / 96). In both cases, when this image is embedded into an RTF
document, its size in the document is 6.4 in. by 4.8 in, since DPI
data is included in the image. The aspect ratio of the graph is retained.
Specifying Output Size with the ODS GRAPHICS statement
You can
control the output size of a graph by specifying the WIDTH= or HEIGHT=
options in the ODS GRAPHICS statement. In the ODS GRAPHICS statement
below, taken from Controlling Graphics with the ODS GRAPHICS Statement, the WIDTH= option changes the width
of the graph to 3.25 inches:
Retaining Aspect Ratio
Although you
can use the ODS GRAPHICS statement to specify both the width and height,
it is highly recommended that only one of these options be specified
at a time. Using one option at a time ensures that the design aspect
ratio of the graph is maintained.
When only width is specified,
SAS uses the design aspect ratio of the graph to compute the appropriate
height. Retaining the design aspect ratio of the graph is important
in many cases as the graph might have a specific layout. For example,
a plot that has multiple columns, or that has a statistics table on
the side needs a wide aspect ratio. Changing the aspect ratio for
this plot by specifying both width and height might produce unpredictable
results.
Graph Scaling For User Specified Image Size
When you use the WIDTH= option in the ODS GRAPHICS statement,
the output size of the graph is computed based on the new size and
the active DPI, using a baseline DPI of 96. All graphical elements
such as marker size, line thickness, font size, and gutters are scaled
using a non-linear scale. This is done to prevent rapid shrinking
or growth of the fonts and markers.
Scaling of graph elements
for change in graph size can be disabled by the ODS GRAPHICS statement
options NOSCALE or SCALE=OFF. By default, scaling is on. Specifying
NOSCALE or SCALE=OFF prevents the scaling of the graph elements. If
you want to shrink your graph and keep the default sizes for fonts,
use the NOSCALE or SCALE=OFF option in the ODS GRAPHICS statement.
Tip For Embedding Graph Images in Documents
It
is often useful to produce a graph that fits in one column of a two
column page. In this case, the column size might be 3.25 inches wide.
You can place a default output image, which is 640 by 480 pixels,
in this space, but then all graphical elements scale down. This results
in small markers and unreadable small fonts.
In this case, it is
useful to render the graph to the exact size required, and specify
the correct DPI. In the situation above, you would specify a width
of 3.25 inches and use the IMAGE_DPI= destination statement option
to specify a DPI of 200. Then, the graph produced can be placed in
the 3.25" wide column and the fonts and markers are readable.
Adding Data Tips and Other Features
With ODS GRAPHICS statement
options, you can control different features of your graphs, such as
borders and data tips. In the ODS GRAPHICS statement below, taken
from Controlling Graphics with the ODS GRAPHICS Statement, the BORDER=OFF option specifies that there be no border
around the graph. The IMAGEMAP=ON option enables the generation of
data tips and any drill downs:
When viewing
HTML output, data tips appear when you move a mouse over certain features
of the graph. Data tips and URL drill down functionality are available
only for the HTML destination. You can also specify the maximum number
of distinct mouse over areas allowed before data tips are disabled
by using the TOOLTIPMAX= option. There are many other ODS GRAPHICS
options that you can use to control other aspects of your graphics. For more information,
see ODS GRAPHICS Statement in SAS Output Delivery System: User's Guide.
Resetting ODS GRAPHICS Options
You can specify the RESET option
to change the values for these options back to their defaults. In Controlling Graphics with the ODS GRAPHICS Statement, the second ODS GRAPHICS statement uses the RESET=ALL
option to set all options back to their defaults for a new graph:
Accessing Graphs as Separate Files
ODS enables
you to change the ODS destination where you are sending your output
to result in different output formats such as RTF or PDF. There might
also be times when you want to access your graphs as individual image
files.
The default image file
type is determined by the ODS destination. You can use the OUTPUTFMT=
option to specify a different image file format. The type of image
allowed is dependent on the destination that you have specified.
You can also specify
names for your graphics image files and the directory in which you
want to save them. The IMAGENAME= option specifies the base image
filename and the GPATH= option specifies a directory for your images.
In the ODS
GRAPHICS statement below, taken from Controlling Graphics with the ODS GRAPHICS Statement, the OUTPUTFMT= option specifies that the file type is
a
GIF, and the IMAGENAME= option specifies
that the name of the image is “MyBoxplot”:
The resulting
filename for the image created is
MyBoxplot.GIF.
If there is more then one image, they are named MyBoxplot1.GIF, MyBoxplot2.GIF,
and so on.
The following ODS GRAPHICS
statement specifies the RESET=ALL option, which changes the image
filename and format to the defaults:
You can use
the GPATH= option to specify a directory for saving your graphics
image files. For example, in Controlling Graphics with the ODS GRAPHICS Statement the GPATH= option on both of the
ODS HTML statements specifies that all images be saved in the directory
C:\myfiles\images.
See Also
Supported File Types for Output Destinations in SAS Output Delivery System: User's Guide
Description of Supported File Types in SAS Output Delivery System: User's Guide
See Also
ODS GRAPHICS Statement in SAS Output Delivery System: User's Guide