Example Program and Statement Details
Example Graph 1
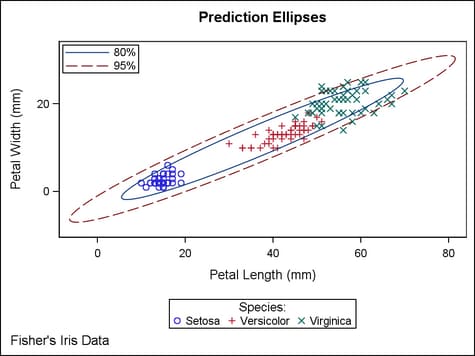
The following graph
using the DISCRETELEGEND statement was generated by Example Program 1. It displays two discrete legends,
one that shows the confidence limits for two ellipses and a second
that shows the values for a GROUP= variable:
Example Program 1
proc template;
  define statgraph discretelegend;
    begingraph;
     entrytitle "Prediction Ellipses";
     layout overlayequated / equatetype=equate;
      scatterplot x=petallength y=petalwidth /
        group=species name="s";
      ellipse x=petallength y=petalwidth /
        type=predicted  alpha=.2
        name="p80" legendlabel="80%"
        outlineattrs=graphconfidence;
      ellipse x=petallength y=petalwidth /
        type=predicted  alpha=.05
        name="p95" legendlabel="95%"
        outlineattrs=graphconfidence2;
      discretelegend "s" / title="Species:" ;
      discretelegend "p80" "p95" / across=1
        autoalign=(topleft) location=inside ;
     endlayout;
     entryfootnote halign=left "Fisher's Iris Data";
    endgraph;
  end;

proc sgrender data=sashelp.iris template=discretelegend;
run;
Example Graph 2
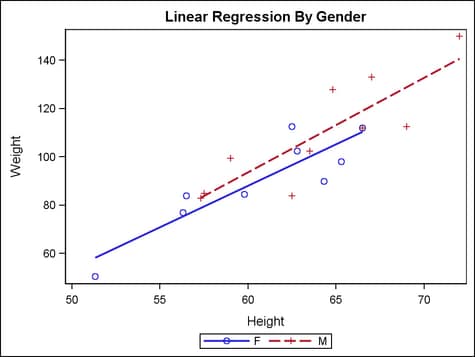
The following graph
using the MERGEDLEGEND statement was generated by Example Program 2. In the template definition, a grouped
scatter plot is overlaid with a series plot for each group, and the
two plots are referenced by a single merged legend:
Example Program 2
proc template;
  define statgraph mergedLegend;
    begingraph;
      Layout overlay;
        scatterplot x=age y=height / group=sex name='scatter';
        seriesplot x=age y=height / group=sex name='series' connectorder=xaxis;
        mergedlegend 'scatter' 'series' ;
      endlayout;
    endgraph;
  end;

proc sgrender data=sashelp.class template=mergedLegend;
run;
Statement Summary
A discrete legend consists
of one or more units called legend entries. Each legend entry consists
of a legend symbol and a legend value. The legend symbol is typically
a marker, line, or filled symbol that represents a specific area in
the plot. The legend value is descriptive text that is derived from
group values, or assigned with the plot’s LEGENDLABEL= option,
or with the LEGENDITEM statement’s LABEL= option.
To specify a discrete legend, you can use the DISCRETELEGEND statement.
To consolidate legend entries for common grouped values that are represented
by two separate plots, you can use the MERGEDLEGEND statement.
For grouped plots, a discrete
legend represents all of the values that are present in the data.
To ensure that legend entries are displayed for group values, regardless
of whether those values are present in the data, you can define an
attribute map for the group values. You can then specify that attribute
map directly in the DISCRETELEGEND statement. For more information
and an example, see the DISCRETEATTRMAP statement’s Statement Summary.
The DISCRETELEGEND statement
can specify one or more names that reference the source for the legend
entry values. You can use the TYPE= option to control the visual attributes for the legend
display. The TYPE= option is required when you specify an attribute
map directly in the DISCRETELEGEND statement.
For legend items that
represent fills or colors without a specific shape, a filled symbol
with a one pixel, solid outline is used to represent the data values.
If the feature being represented by the legend item has an outline,
the default outline color is derived from the feature’s outline
color. If the feature does not have an outline, the default outline
color for its corresponding legend entry is derived from the GraphOutline
style-element.
The MERGEDLEGEND statement
can be used to consolidate lines and marker symbols from discrete
legend entries when a graph displays grouped values for exactly two
plots. With a MERGEDLEGEND statement, the legend values from the group
variables in two plots are compared. For each common value, the corresponding
legend lines and marker symbols are combined, creating only one legend
entry for each matching set of group values. The MERGEDLEGEND statement
can be used only for grouped plots and must specify two names that
reference the source for the legend entry values.
Within an overlay-type
layout, when a discrete legend is placed inside the plot area with LOCATION=INSIDE,
-
By default, its background is fully transparent (OPAQUE=FALSE), meaning that underlying lines, markers, and data labels show through the legend.
-
Its position can be controlled with the AUTOALIGN= option, or with the HALIGN= and VALIGN= options. (The AUTOALIGN= option is not available in a LAYOUT OVERLAY3D statement.)
Within an overlay-type
layout, when a discrete legend is placed outside the plot area with
LOCATION=OUTSIDE,
When a discrete legend
is placed within nested layouts, it might be necessary to do one of
the following to obtain the desired legend organization:
A legend might be dropped
if the total legend area in the graph exceeds the percentage that
is set by the MAXLEGENDAREA= option in an ODS GRAPHICS ON statement
that is in effect for the output destination. A legend might also
be dropped if DISPLAYCLIPPED=FALSE and the full legend cannot be
displayed.
Arguments
references one or more
unique names that are specified by the NAME= option of a plot statement.
These names control which plots contribute to the legend, and the
order in which the legend entries occur. If a contributing plot uses
a GROUP= option, then there is a legend entry for each group value
that is present in the data.
references one or more
unique values specified by the NAME= option of a LEGENDITEM statement.
Each legend-item-name must
be enclosed in quotation marks.
references one or more
unique values specified by the NAME= option of a DISCRETEATTRMAP statement.
This usage results in the referenced discrete attribute map contributing
all its value statements as legend entries, regardless of whether
they match the data. Each discrete-attribute-map-name must
be enclosed in quotation marks. For more details and an example use,
see the DISCRETEATTRMAP statement’s Statement Summary.
Options
The following options
are available for both the DISCRETELEGEND and MERGEDLEGEND statements,
unless noted otherwise.
specifies the number
of legend entries that are placed horizontally before the next row
begins. A legend entry typically consists of two parts, such as a
marker symbol and an associated value.
specifies whether the
legend is automatically aligned within its parent layout when nested
within an overlay-type layout. For more information about how child
positions are determined in an overlay-type layout, see the LAYOUT
OVERLAY’s Statement Summary.
Available only if the
parent layout contains a scatter plot; ignored otherwise. Within the
parent layout, attempt to center the legend in the area that is farthest
from any surrounding data point markers.
Within the parent layout,
restrict the legend’s possible locations to those locations
in the specified location-list,
and use the location-list position
that least collides with the parent layout’s other graphics
features. The location-list is
blank-separated and can contain any of these locations: TOPLEFT, TOP,
TOPRIGHT, LEFT, CENTER, RIGHT, BOTTOMLEFT, BOTTOM, and BOTTOMRIGHT.
specifies that all
markers, lines, and filled symbols in the legend are sized in proportion
to the font size used for the legend entry labels. These proportional
sizes take effect regardless of the size reported by the plot or LEGENDITEM.
The line segments are drawn as deemed appropriate by the legend, regardless
of the line thickness reported by the plot.
Interaction:When
set to TRUE, this setting considers the font size in effect from the VALUEATTRS= option.
specifies the attributes
of the border line around the legend. See General Syntax for Attribute Options for the syntax
on using a style-element and Line Options for available line-options.
specifies whether the
legend is displayed when any portion of the legend cannot be rendered
entirely.
Discussion: Based
on the legend contents and placement, or when the graph size is reduced,
parts of the legend (title, legend symbol, or legend value) might
be clipped (truncated). When clipping occurs and this option is set
to FALSE, the entire legend is removed from the graph. The space for
that legend is then reclaimed by the remainder of the graph. When
this option is set to TRUE, the legend always appears, even if some
parts of it have been clipped.
specifies the number
of legend entries that are placed vertically before the next column
begins. A legend entry typically consists of two parts, such as a
marker symbol and an associated value.
specifies the horizontal
alignment of the legend within its parent layout when nested within
an overlay-type or region layout. For more information about how child
positions are determined in an overlay-type or region layout, see
the LAYOUT OVERLAY’s Statement Summary.
Range: A number specification
can range from 0 to 1. The number represents
a fraction of the parent container’s width, where 0 is all
the way to the left and 1 is all the way to the right.
Restriction: This
option is available only when this statement is nested within an overlay-type
or region layout. It is ignored if the parent layout is not an overlay-type
or region layout.
specifies whether the
legend appears inside or outside the plot area when the legend is
specified within an overlay-type or region layout.
Restriction: This
option has effect only when the legend statement appears within an
overlay-type or region layout and at least one stand-alone plot statement
is referenced by the parent layout. For more information about how
child positions are determined in an overlay-type or region layout,
see the LAYOUT OVERLAY’s Example Program and Statement Details.
Interaction: The
actual position is determined by the settings for the LOCATION=, AUTOALIGN=, HALIGN=, and VALIGN= options.
specifies the amount
of extra space that is reserved inside the legend perimeter.
Default: The
default padding for all sides is 0. Values without units are in pixels
(px). A unit must be provided if other than pixels.
Specifies a dimension
to use for the extra space at the left, right, top, and bottom of
the legend perimeter.
Enables separate settings
for the left, right, top, and bottom padding dimensions. Use the pad-options to
create non-uniform padding. These options must be enclosed in parentheses.
Each option is specified as a name = value pair.
Sides not assigned padding are padded with the default amount.
| LEFT=dimension | specifies the amount of extra space added to the left side. |
| RIGHT=dimension | specifies the amount of extra space added to the right side. |
| TOP=dimension | specifies the amount of extra space added to the top. |
| BOTTOM=dimension | specifies the amount of extra space added to the bottom. |
specifies the sort
order to use for the legend entry labels.
Default:
AUTO. Groups of legend entries are presented in the order in which
they are listed in the legend statement. The internal ordering of
the entries is derived from the constituent plot-statement options
or the attribute map.
Interaction:
This option overrides the order that is set by any constituent plot
statement’s GROUPORDER= option.
specifies the color
and font attributes of the legend title. See General Syntax for Attribute Options for the syntax
on using a style-element and Text Options for available text-options.
specifies a border
around the legend title that separates it from the legend body.
The line attributes
of the title border are set by the BORDERATTRS= options.
specifies which visual
attributes to display for legend entries in the legend.
-
This option is required when a discrete attribute map is directly referenced by the legend. Keyword ALL, the default, cannot be used in that case, and this option must be used to change the default. If the value ALL is not changed, the discrete-attribute map’s contributions to the legend entries are ignored.
Discussion:
This option can be used as a filter. If a statement contributing to
the legend does not have any visual attributes that match the TYPE
specified, the legend does not display any entries from that statement.
Some keywords can be
used to create specialized legends that display a single visual attribute.
For example, keywords FILLCOLOR or MARKERSYMBOL result in the display
of a single attribute. Other keywords (for example, FILL, LINE, or
MARKER) result in legends that display a set of visual attributes.
For example, keyword LINE results in the display of both line color
and line pattern for legend entries that include lines in their display.
If this option is set
to LINEPATTERN or MARKERSYMBOL, a filled symbol is drawn using the
same text color as the color used for the legend entry labels. The
symbol is sized automatically, as if the AUTOITEMSIZE= option is set to TRUE. For keywords
LINECOLOR and MARKERCOLOR, the filled symbols are drawn as color swatches.
specifies the vertical
alignment of the legend within its parent layout when nested within
an overlay-type or region layout. For more information about how child
positions are determined in an overlay-type or region layout, see
the LAYOUT OVERLAY’s Statement Summary.
Range: A number specification
can range from 0 to 1. The number represents
a fraction of the parent container’s height, where 0 is on
the bottom and 1 is on the top.
Restriction: This
option is available only when this statement is nested within an overlay-type
or region layout. It is ignored if the parent layout is not an overlay-type
or region layout.
specifies the color
and font attributes of the legend values. See General Syntax for Attribute Options for the syntax
on using a style-element and Text Options for available text-options.