Example Program and Statement Details
Example Program
data workers;
format Date monyy5.;
input Date monyy5. Electric Masonry;
datalines;
JAN80 320.3 293.8
FEB80 315.7 285.8
MAR80 312.6 292
APR80 306.5 299.3
MAY80 308.6 301.7
JUN80 316.3 307.9
JUL80 319.5 310.7
AUG80 326.4 314.9
SEP80 330.8 312.7
OCT80 329.3 318.5
NOV80 330.6 307.7
DEC80 327.2 296.2
JAN81 316.2 259.2
FEB81 310.1 258.8
MAR81 308.5 271.5
APR81 311.1 281
MAY81 313.6 283.7
JUN81 318.3 289.3
JUL81 321.3 291.1
AUG81 327.4 295.9
SEP81 326.7 292.7
OCT81 326.4 282.6
NOV81 322.5 275.5
DEC81 318.6 260.2
JAN82 301.9 214.3
FEB82 296.1 224.8
MAR82 298.3 228.7
APR82 297.7 244.7
MAY82 303.5 260.4
JUN82 305 262.2
JUL82 307.6 270.4
;
proc template;
define statgraph layoutoverlay;
begingraph;
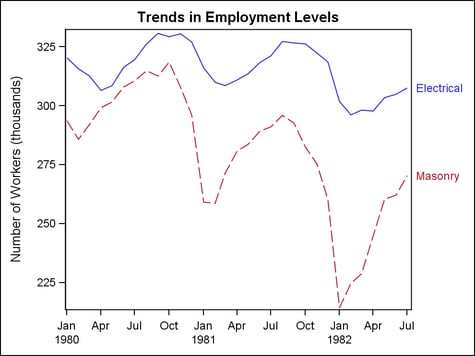
entrytitle "Trends in Employment Levels";
layout overlay / cycleattrs=true
xaxisopts=(display=(ticks tickvalues))
yaxisopts=(label="Number of Workers (thousands)");
seriesplot x=date y=electric /
curvelabel="Electrical"
curvelabellocation=outside;
seriesplot x=date y=masonry / curvelabel="Masonry"
curvelabellocation=outside;
endlayout;
endgraph;
end;
run;
proc sgrender data=workers template=layoutoverlay;
run;
Statement Summary
The LAYOUT OVERLAY statement
builds a composite using one or more GTL-statements. You can specify one or more two-dimensional plots within the layout,
provided all plots can share the same type of axes. You can also specify
one or more insets, such as nested layout statements (for example,
LAYOUT GRIDDED), ENTRY statements, and legend statements (for example,
CONTINUOUSLEGEND or DISCRETELEGEND).
Note: The details for positioning
insets also apply to insets that are specified within a LAYOUT REGION
block.
-
All plot statements are rendered first. Plot statement results are always rendered in the plot area. The plots are stacked on top of one another in the order in which they are specified, with the last one on top. It is possible for one plot’s graphical data to obscure graphical data beneath it. You can control this by selectively ordering the plot statements, or by using transparency on the individual plots, or by doing both.
-
To control the horizontal and vertical positioning of some insets, you can use the inset statement’s AUTOALIGN= option, or its HALIGN= and VALIGN= options. Each nested inset determines its own relative position in the parent OVERLAY. This positioning achieves the best results for text-based insets whose size can be easily fit within an open area of the graph wall. A large text-based inset might not fit well, and an inset that contains a plot might be dropped from the display without warning when the template is executed.
Generally, the first
specified plot determines the layout’s default axis characteristics.
To enable another plot to define the axis characteristics, set PRIMARY=TRUE
for that plot. For more information about the default axis characteristics,
see When Plots Share Data and a Common Axis.
INNERMARGIN Statement
An “inner margin”
is a nested region at the top or bottom of the OVERLAY container.
One or more inner margin plots can be specified, and each is specified
within an INNERMARGIN block. Within the INNERMARGIN block, only a
block plot can be specified. The following general syntax is used
for the INNERMARGIN statement:
The following example
places a block plot in the inner margin region. The , INNERMARGIN
statement uses the default alignment, so the inner margin is positioned
at the bottom of the layout container, beneath the series plot:
Options
specifies the attributes
of the border line around the layout. See General Syntax for Attribute Options for the syntax
on using a style-element and Line Options for available line-options.
specifies whether the
default visual attributes of markers, lines, and fills in nested plot
statements automatically change from plot to plot. See Cycling through Group Attributes in Overlaid Plots for more information.
does not cycle the
default visual attributes of multiple plots. For example, if you overlay
three series plots, each series line has the same default visual properties.
the system looks at
the plots in the layout and tries to use the GraphData1 - GraphDataN
style elements to assign different visual properties to applicable
plots (scatter plots and series plots and others). For example, if
you overlay three series plots, the three series lines receive different
default visual properties (line pattern and color). These default
properties are determined by the next GraphDataN style element not
already used. Some plots in the layout do not participate in the cycling
(for example, reference lines and drop lines).
specifies the amount
of extra space that is added inside the layout border.
Default: The default padding for all sides is 0. Values without units are
in pixels (px). A unit must be provided if other than pixels.
Enables separate settings
for the left, right, top, and bottom padding dimensions. Use the pad-options to create non-uniform padding. These
options must be enclosed in parentheses. Each option is specified
as a name = value pair. Sides
not assigned padding are padded with the default amount.
| LEFT=dimension | specifies the amount of extra space added to the left side. |
| RIGHT=dimension | specifies the amount of extra space added to the right side. |
| TOP=dimension | specifies the amount of extra space added to the top. |
| BOTTOM=dimension | specifies the amount of extra space added to the bottom. |
specifies whether the
plot’s wall and wall outline are displayed.
Use the WALLCOLOR= option to control the fill color
of the wall.
specifies one or more
X axis options. For a list of options, see Axis Options for LAYOUT OVERLAY.
specifies one or more
X2 axis options. For a list of options, see Axis Options for LAYOUT OVERLAY.
specifies one or more
Y axis options. For a list of options, see Axis Options for LAYOUT OVERLAY.
specifies one or more
Y2 axis options. For a list of options, see Axis Options for LAYOUT OVERLAY.