Example: Generating a Single SVG File with Multiple Pages and Page Controls
The SVGVIEW device is
designed to be used when in the LISTING destination. It is useful
when a single procedure produces multiple graphs, such as with BY-group
processing. When used in the LISTING destination, the SVGVIEW device
creates a single SVG file with multiple pages. Each graph produced
by the procedure is on a different page. The SVG file, by default,
has control buttons that enable you to navigate forward and backward
through the graphs as well as display an index page that shows a thumbnail
image of each page.
For example, the following display shows the initial graph
that is produced by the program in Program Code: Using the SVGVIEW Device with BY-Group Processing. The program
produces six graphs. You can page through them by clicking on the Prev and Next buttons.
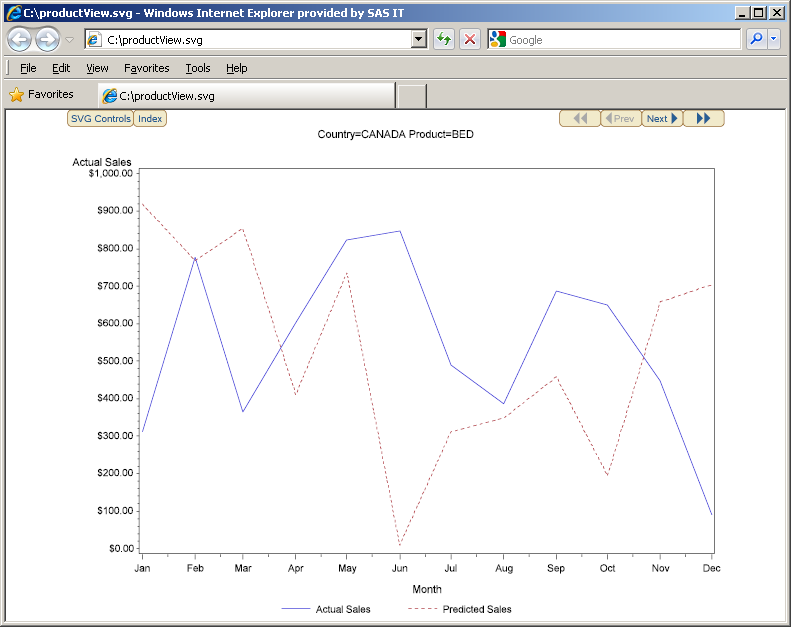
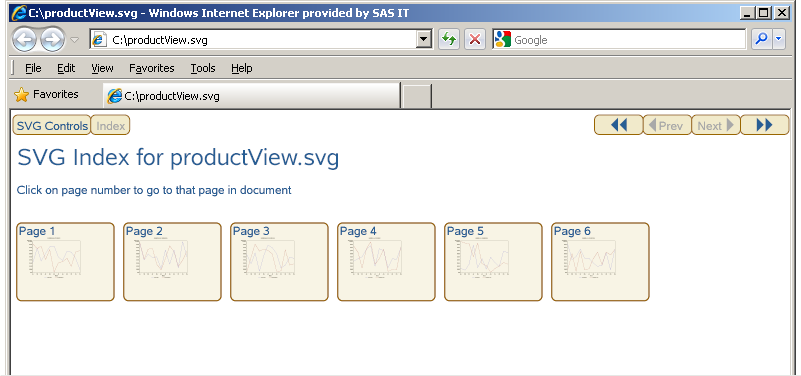
The Index button displays a page of thumbnail images. There is one thumbnail
for each page in the SVG file that, when clicked, take you to that
page.
Program Code: Using the SVGVIEW Device with BY-Group Processing
/* Subset the data set SASHELP.PRDSALE. */
/* Output the subset to WORK.PRODSUB.   */

data prodsub;
  set sashelp.prdsale;
  where year=1994 and
     (country = "U.S.A." or country = "CANADA")
      and region="EAST" and division="CONSUMER" and
     (product in ("SOFA", "TABLE", "BED"));
run;

/* Sort WORK.PRODSUB. */

proc sort data=prodsub;
   by country product;
run;

/* Close the HTML destination, and */
/* open the LISTING destination.   */
ods html close;
ods listing;

/* Define a fileref for the SVG file.   */
/* Use the GSFNAME= option to send the  */
/* output of the LISTING destination to */
/* that fileref.                        */

filename mysvg "productView.svg";
goptions reset=all device=svgview
         gsfmode=replace gsfname=mysvg;

/* Join the data points and change the */
/* line style for the predicted sales  */
/* to a dashed line.                   */

symbol1 interpol=join line=1 color=_style_;
symbol2 interpol=join line=2 color=_style_;
legend1 label=none;

/* Generate a graph for each unique    */
/* combination of country and product. */

proc gplot data=work.prodsub;
   by country product;
   plot actual*month predict*month /
        overlay legend=legend1;
run;
quit;

/* Close the LISTING destination,   */
/* and reopen the HTML destination. */
ods listing close;
ods html;
When used in the HTML
destination, the SVGVIEW device produces separate SVG files for each
graph, just like the SVG device.
For additional information, see Multi-Page SVG Documents in a Single File in SAS Language Reference: Concepts and Creating Separate Files for Multi-Page SVG Documents in SAS Language Reference: Concepts.