Creating SVG (Scalable Vector Graphics) Files Using Universal Printing
Overview of Scalable Vector Graphics in SAS
Scalable Vector Graphics in SAS
Scalable Vector Graphics
(SVG) is an XML language for describing two-dimensional vector graphics.
SAS creates SVG documents based on the W3C recommendation for SVG
documents. SAS SVG documents are created using the UNICODE standard
encoding UTF-8.
SAS can create SVG documents
by using either universal printers or SAS/GRAPH device drivers. SVG
documents that are created by universal printers are stand-alone SVG
documents. SVG documents that are created by SAS/GRAPH device drivers
can be either stand-alone SVG documents or SVG documents that are
embedded in HTML documents. In SAS/GRAPH, SVG device drivers are shortcuts
to the SVG universal printers.
A stand-alone SVG document
can be embedded in an HTML document by reference as an external link,
embedded inline, or as a CSS2 or XSL property reference. For information
about embedding SVG documents in Web pages, see the topic on using
SVG documents in Web pages in the SVG 1.1 specification on the W3
SVG Web site http://www.w3.org/TR/SVG.
SVG documents created
by Universal Printing without SAS/GRAPH are static SVG documents.
If you have SAS/GRAPH installed, your SVG documents can contain animation,
links, and pop-up text boxes. For more information
about creating SVG files in SAS/GRAPH, see Enhancing Web Presentations with Chart Descriptions, Data Tips, and Drill-Down Functionality in SAS/GRAPH: Reference.
The information provided
here is limited to creating SVG documents using universal printers.
For complete information about SVG documents, see the W3C recommendations
for SVG documents. For information about creating SVG documents using
SAS/GRAPH, see SAS/GRAPH: Reference.
SVG Terminology
a finite rectangular
space within the SVG canvas where an SVG document is rendered. In
SAS, the viewport is determined by the value of the PAPERSIZE= system
option for a scalable viewport and by the SVGWIDTH= and SVGHEIGHT=
system options for a static viewport.
Why Create SVG Documents?
SVG documents display clearly
at any size in any viewer or browser that supports SVG. SVG documents
are ideal for producing documents to display on a computer monitor,
PDA, or cell phone; or documents to be printed. Because it is a vector
graphic, a single SVG document can be transformed to any screen resolution
without compromising the clarity of the document. In comparison, a
multiple raster graphic image might require using different screen
resolutions in order to display the image at various screen resolutions
and sizes.
Web Server Content Type for SVG Documents
The SVG Universal Printers and the Output That They Create
SVG Universal Printers
|
SVG 1
|
|
|
produces SVG 1.1 animated
documents. Animation timing is static if you use this printer and
do not have
|
|
|
SVGt 1
|
|
|
SVGZ 1
|
|
|
SVGView 1
|
|
| 1When you use this printer
in |
|
SVG prototypes for creating
printers are available in the SAS Registry under CORE\PRINTING\PROTOTYPES.
You can define your own SVG printer using the PRTDEF procedure. For
more information, see PRTDEF Procedure in Base SAS Procedures Guide and Managing Universal Printers Using the PRTDEF Procedure.
How to Create SVG Documents
Fundamentals of Creating SVG Documents Using Universal Printers
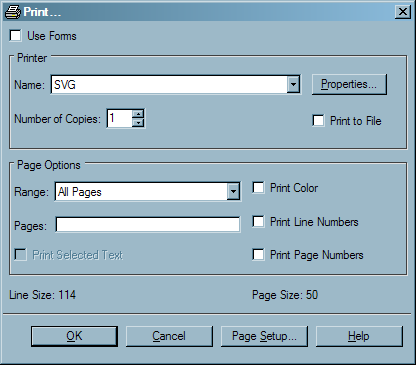
To create SVG documents
by using the Print dialog box, select an
SVG printer from the Name drop-down list box.
To create SVG documents
programmatically, specify an SVG universal printer as the value of
the PRINTERPATH= system option and specify the ODS PRINTER statement,
as shown below.
options printerpath=svg;
ods html close;
ods printer;

...more SAS code...

ods printer close;
ods html;
Alternatively, you can specify the SVG printer in the ODS PRINTER
statement and eliminate the OPTIONS statement, as shown below.ods html close;
ods printer printer=svg;
...more SAS code...
ods printer close;
ods html;SAS
has several system options that enable you to modify various aspects
of your SVG document. Here are some SVG document traits:
By using the NEWFILE option in the ODS PRINTER statement,
you can create an SVG document for the output from each procedure
or DATA step.
For more information,
see the following language elements:
-
PRINTERPATH= System Option in SAS System Options: Reference
-
ODS PRINTER Statement in SAS Output Delivery System: User's Guide
Summary of Statements and the SVG Documents That They Create
Browser Support for Viewing SVG Documents
Browsers That Support SVG Documents
In order to view SVG
documents, you need a viewer or browser that supports Scalable Vector
Graphics. Some browsers, such as Mozilla Firefox, have built-in support
for SVG documents. Other browsers, such as Microsoft Internet Explorer,
require an SVG plug-in to view SVG documents. One such plug-in is
available from Adobe Systems, Inc.
SVG Browser Support
|
Adobe SVG Viewer 3 1
|
|
| 1Adobe SVG Viewer 3 works in Internet Explorer 7 and Internet Explorer 8. It is no longer supported by Adobe Systems Inc. | |
Notes on Using Adobe SVG Viewer
-
There is a known problem that causes an SVG graph to be stretched out using an incorrect aspect ratio when you print an SVG document that is displayed in the Adobe SVG Viewer 3. To work around this problem, use the X at the top of the window to close the Print Preview window. Do not use the Close button. Preview the SVG document again. The graph now appears with the correct aspect ratio and can be printed by selecting Print from the Print Preview window.
Notes on Using Mozilla Firefox
-
Firefox does not support font embedding. To avoid font mapping problems in your SVG document, you can set the NOFONTEMBEDDING system option. If the FONTEMBEDDING option is set when an SVG document is created and the SVG document is subsequently viewed in Firefox, Firefox uses the default font setting that is defined on the Contents tab in the Firefox Options dialog box.
Images in SVG Documents
When your
SAS program creates an SVG document that contains images, SAS does
the following for each image in the document:
In the SVG document,
the
<image> element has an xlink attribute that begins as follows:xlink:href="data:image/png;base64,The base64 encoded image follows after
base64,.
By default, the SVG
Universal printer encodes PNG files and embeds them in the SVG document.
In the following example, you see the <image> element at the
bottom. The encoded image begins after the /png;base64, element attribute.
The encoded image begins with
iVBORwOK and
extends to the right on the same line. It cannot be shown in this document.
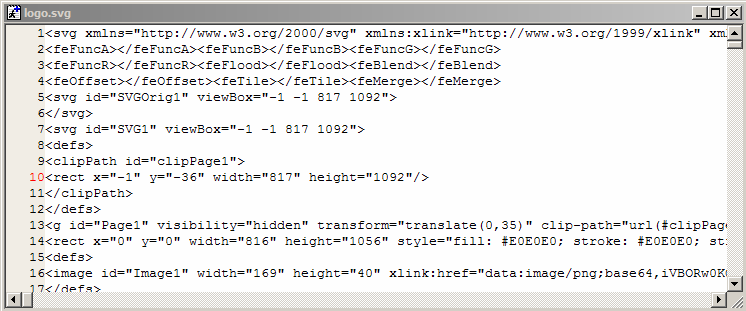

The following program
created the embedded image:
proc template;
   define style logo;
      parent = Styles.default;
      style Body from Body /
         backgroundimage = 'c:\saslogo.gif';
   end;
run;

ods html close;
options nodate nonumber orientation=landscape obs=5;

ods printer style=logo printer=svgview file='logo.svg';

proc print data=sashelp.class;
   title 'Five Observations of sashelp.class';
run;
ods printer close;
ods html;
An alternative to embedding
encoded PNG files in an SVG document, the SVG universal printer can
create separate PNG files and link to them from within the SVG document.
Here is an example of an <image> element in an SVG document:
<image id="Image3" width="200" height="150" xlink:href="I3svgimg.png">
</image>
The SVG universal printer
creates separate PNG files when the SVG printer that you are using
has the Images Embedded registry setting
set to 0.
The PNG filename has
the form IcounterPrinterDestinationFilename.png. counter is an integer that is incremented each
time a new image is created. PrinterDestinationFilename is the output destination filename for the printer. For example,
using the default printer destination filename, sasprt, the first
three images would be named I1sasprt.png, I2sasprt.png, and I3sasprt.png.
Setting the Environment to Create Stand-alone SVG Documents
Overview of Setting the Environment to Create Stand-alone SVG Documents
As shown in Fundamentals of Creating SVG Documents Using Universal Printers, an SVG universal printer must be specified either as the
printer value using the PRINTERPATH= system option or the ODS Printer
statement. You can set any of the SVG system options when SAS is invoked
in a SAS program by using the OPTIONS statement, or by using the SAS System Options window.
SAS System Options That Affect Stand-alone SVG Documents
Setting the SVG Universal Printer
You set the SVG universal
printer by setting the PRINTERPATH= system option to one of the SVG
universal printers. You can set the PRINTERPATH= system option at
any time. The following OPTIONS statement sets the universal printer
to create compressed SVG documents:
options printerpath=svgz;
For more information,
see the following topics:
-
PRINTERPATH= System Option in SAS System Options: Reference
Scaling an SVG Document to the Viewport
To scale an SVG document to the
viewport, you can use the default value of null for the SVGHEIGHT=
and SVGWIDTH= system options. A null value equates to the value of
100%, which scales the SVG document to the size of the viewport. In
addition, the value of the SVGVIEWBOX= system option must be null.
Setting the ViewBox
The
viewBox attribute on the
<svg> element
is a set of four numbers: the starting X coordinate, the starting
Y coordinate, the height of the SVG document, and the width of the
SVG document. SAS sets the viewBox attribute value from the value
of the SVGVIEWBOX= system option. If that option has no value, SAS
uses the value of the PAPERSIZE= system option to set the height and
the width arguments of the viewBox attribute. The starting coordinate
values are set to 0.
When the SVGVIEWBOX=,
SVGHEIGHT=, and SVGWIDTH= system options have a null value (the default
value for each of these system options), the SVG document scales to
the size of the viewport. If you specify a value for the SVGVIEWBOX=
system option, the SVG document is scaled to the dimensions specified
in the SVGVIEWBOX= option.
If you specify the SVGHEIGHT=
option and the SVGWIDTH= option using percentage units, the SVG document
scales to the size of the browser window whenever the browser window
changes size. If these options are specified using units other than
percentage, such as in, cm, or px, the SVG document is a static size
and does not scale to the browser window when the window changes size.
For more information,
see the following topics:
-
ODS PRINTER Statement in SAS Output Delivery System: User's Guide
-
SVGVIEWBOX= System Option in SAS System Options: Reference
-
PAPERSIZE= System Option in SAS System Options: Reference
Interaction between SAS SVG System Options and the SVG Element Attributes
SAS uses the values of the SVGHEIGHT=, SVGWIDTH=,
SVGVIEWBOX=, SVGPRESERVEASPECTRATIO=, SVGX=, and SVGY= system options
as values for their respective attributes on the outermost <svg>
element: height, width, viewBox, and preserveAspectRatio. For example,
if you specify SVGWIDTH=“400” and SVGHEIGHT=“300”,
SAS creates the <svg> element with the attributes width=“400”
and height=“300”. The values of the SVGX= and SVGY=
system options are used only on embedded <svg> elements for
the x and y attributes.
All of these system
options have a null default value. When the SVGVIEWBOX= system option
is null, SAS determines the viewBox size based on the value of the
PAPERSIZE= system option. Therefore, if you do not specify a value
for any of these system options, the only <svg> attribute that
SAS sets is the viewBox attribute using the SAS SVG system options.
Other <svg> attributes, such as version and xmlns are set by
SAS and not by using system options.
SAS creates the following
<svg> element when all of the SAS SVG system options are set
to their default values:
<svg xmlns="http://www.w3.org/2000/svg"
     xmlns:xlink="http:://www.w3.org/1999/xlink"
     xml:space="preserve" onload='Init(evt)'
     version="1.1" baseProfile="full" viewBox="-1 -1 801 601">
The SVGPRESERVEASPECTRATIO=
system option is used to set the preserveAspectRatio attribute in
the <svg> element and has an effect only when the viewBox attribute
has also been specified in an SVG document.
Negative values can
be specified for the values of SVG options. However, if a negative
value is specified for the SVGHEIGHT= option or the SVGWIDTH= option,
or the height or width arguments in the SVGVIEWBOX= option, the SVG
document is not rendered by the browser. It can be useful to specify
negative values for the x and y arguments of the SVGVIEWBOX= option
to place the origin of the SVG document. A negative argument in the
SVGVIEWBOX= option shifts the output to the right. A negative value
of the SVGVIEWBOX= option shifts the placement of the document downward.
Creating a Static viewBox
A
static viewBox is a viewBox that cannot be changed. When the viewport
changes, such as when you resize your browser window, the viewBox
remains the same size. To create a static viewBox, you specify the
same width and height values for the PAPERSIZE=, SVGWIDTH=, and SVGHEIGHT=
system options. The PAPERSIZE= system option sets the viewBox. The
SVGWIDTH= and SVGHEIGHT= system options set the size of the SVG document.
IF the SVGHEIGHT= and SVGWIDTH= options are specified using percentage
unit, the SVG document scales to the size of the browser window when
the browser window changes size. A Static Viewbox shows a static viewBox created by using the following system
options:
options nodate printerpath=svg papersize=("8cm" "5cm") svgwidth="8cm" svgheight="5cm"
   svgtitle="SASHELP.CLASS Plotted by The SGPLOT Procedure";
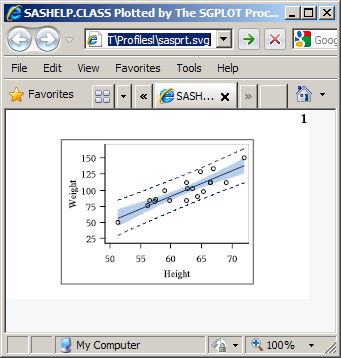
Preserving the Aspect Ratio
When you change the size of the viewBox, you can use
the SVGPRESERVEASPECTRATIO= system option to specify whether you want
to preserve the aspect ratio of the SVG document and how to place
the SVG document in the viewport. Set this option by using one of
the following assignments:
SVGPRESERVEASPECTRATIO=align | meetOrSlice | NONE | “”
SVGPRESERVEASPECTRATIO=“align meetOrSlice”
The first argument, align, specifies whether to force uniform scaling
by specifying the alignment method to use. For example, you can use
the
xMidYMid value to align the midpoint
X value of the viewBox to the midpoint X value of the viewport, which
centers the document horizontally.
The second argument, meetOrSlice, specifies how to scale the SVG document
to the viewBox. The value for this argument can be either
meet or slice. If
you specify meet, the SVG document
is scaled up as much as possible while meeting other criteria. The
viewport displays some unused space. If you specify slice, the SVG document is scaled down as much as
possible while meeting other criteria. In the latter case, some of
the SVG document appears to be cut off. The SVG document is still
complete, but you cannot see all of it in the viewport. You can use
your browser controls to move the SVG document around in the viewport.
For more information,
see SVGPRESERVEASPECTRATIO= System Option in SAS System Options: Reference.
Adding a Title to an SVG Document
You use the
SVGTITLE= system option to add a title to the title bar of a window
when the browser displays only the SVG document. If the SVG document
is embedded in an HTML page, the svgtitle attribute on the <svg>
tag has no effect. The static viewport example in the previous topic
shows a title in the browser title bar.
For more information,
see SVGTITLE= System Option in SAS System Options: Reference.
Creating Stand-alone SVG Documents Using the ODS PRINTER Destination
Creating an SVG Document
To create an SVG document,
you need to at least set the PRINTERPATH= system option to an SVG
Universal printer and specify the ODS PRINTER statement in your SAS
program. Or, specify the PRINTER= option in the ODS PRINTER statement:
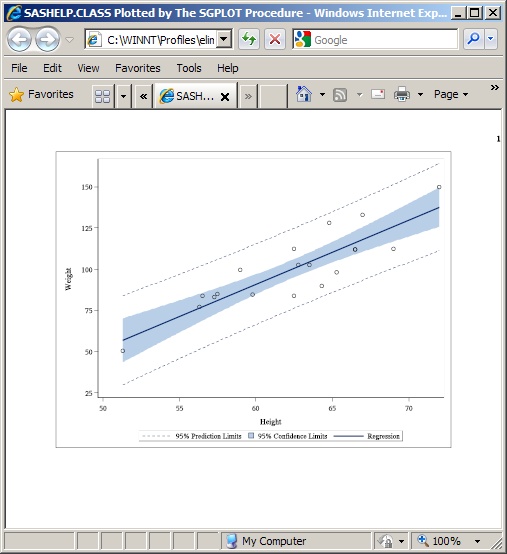
options printerpath=svg;
ods html close;
ods printer;
proc sgplot data=sashelp.class;
  reg x=height y=weight / CLM CLI;
run;
ods printer close;
ods html;
In this example, no
specific SVG system option values were set to size the SVG document.
Therefore, the viewBox is the default size specified by the PAPERSIZE=
system option. The SVG document scales to the viewport because no
value was specified for the SVGWIDTH= and SVGHEIGHT= system options.
The following is the <svg> element that SAS creates:
<svg xmlns="http://www.w3.org/2000/svg"
  xmlns:xlink="http://www.w3.org/1999/xlink" xml:space="preserve"
  onload='Init(evt)' version="1.1" baseProfile="full" viewBox="-1 -1 801 601">
SAS creates a single
SVG document named sasprt.svg and stores it in a specific location,
depending on your operating environment. Under Windows, the file is
stored in the current directory. Under UNIX, the
file is stored in your home directory. Under z/OS , the file is stored
as a z/OS UNIX System Services Hierarchal File System (HFS) file,
or as a z/OS data set. If the SVG file is written to a z/OS data set,
it is written to PDSE library userid.SASPRT.SVG. You can use the FILE= option in the ODS PRINTER statement
to specify a different filename.
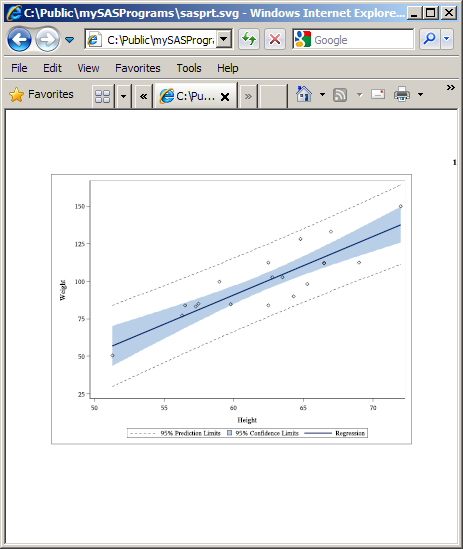
The following figure
is an SVG file that uses the Adobe Acrobat SVG plug-in for Microsoft
Internet Explorer. This file was created by using the SGPLOT procedure
to plot the SASHELP.CLASS data set.
When you use the SVG,
SVGnotip, SVGt, SVGView, and SVGZ universal printers, SAS creates
a single SVG document. Depending on the size of the SVG document,
the browser might display the complete SVG document. Check the documentation
for your browser to determine whether your browser has controls for
viewing SVG documents. In the Adobe SVG Viewer plug-in for Internet
Explorer, you can press the Alt key and the left mouse button to pan
and move to different pages in a continuous, multi-page SVG document.
Multi-Page SVG Documents in a Single File
When a DATA step or procedure
creates a new page in the output, a new SVG page is created in an
SVG document. SAS creates either one file with multiple pages or multiple
SVG files with one file for each SVG document page. The SVGCONTROLBUTTONS
system option and the NEWFILE= option in the ODS PRINTER statement
control whether a multi-page SVG document is one continuous file (with
controls to navigate the pages in the file) or multiple SVG files.
SAS creates a single
file, multi-page SVG document with navigational controls when the
NEWFILE= option of the ODS PRINTER statement is a value other than
PAGE, and one of the following set of system options is specified:
If the SVGCONTROLBUTTONS
system option is not specified or the universal printer is not SVGView,
the SVG document is created in a continuous-page layout. To navigate
the document, you would use your browser controls.
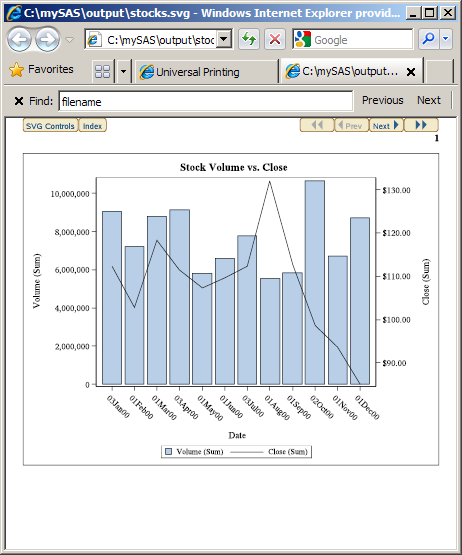
The navigation controls
enable you to go to the next page, the previous page, the first page,
or the last page; to display an index of all pages; or to hide or
show the controls.
To display an index
of all pages in the SVG file, select the Index button. To go to a specific page from the index, select the thumbnail
image of the page.
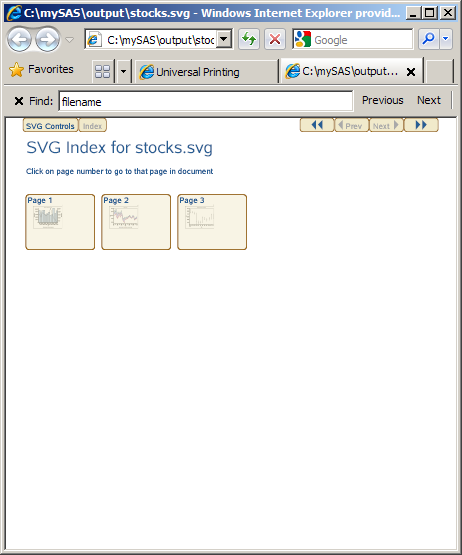
You can hide the control
buttons by selecting the SVG Controls button.
The tooltip displays when the cursor is over the control. To show
the navigation controls again, click in the top area of the output
when you see the tooltip Click to toggle SVG control button
bar. This is useful when you want to print a page in
the document without the SVG controls.
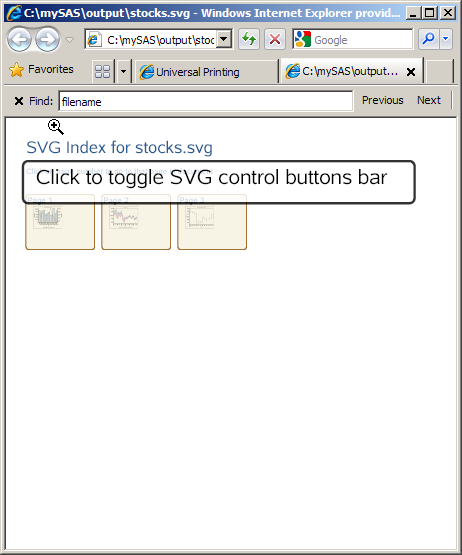
Here is the SAS code
that created the stocks.svg file:
options nodate printerpath=(svgview stocks) papersize=("6" "6") ;
filename stocks 'c:\mySas\output\stocks.svg';
ods html close;
ods printer;
proc sgplot data=sashelp.stocks (where=(date >= "01jan2000"d
                                 and date <= "01jan2001"d
                                 and stock = "IBM"));
   title "Stock Volume vs. Close";
   vbar date / response=volume;
   vline date / response=close y2axis;
run;
title;
proc sgplot data=sashelp.stocks
  (where=(date >= "01jan2000"d and stock = "IBM"));
  title "Stock Trend";
  series x=date y=close;
  series x=date y=low;
  series x=date y=high;
run;
title;
title "Stock High, Low, and Close";
proc sgplot data=sashelp.stocks;
  where Date >= '01JAN2005'd and stock='IBM';
  highlow x=date high=high low=low
    / close=close;
run;
title;
ods printer close;
ods html;
For information about
the NEWFILE= option, see ODS PRINTER Statement in SAS Output Delivery System: User's Guide.
Creating Separate Files for Multi-Page SVG Documents
You can create a separate
file for each page in an SVG document by specifying the NEWFILE=PAGE
option in the ODS PRINTER statement. A new page is created when a
procedure explicitly starts a new page and not when the page size
is exceeded. The first file is named filename.svg. Subsequent filenames have a number appended, starting with
the number 1: filename1.svg, filename2.svg, and so on.
Using the default filename
sasprt.svg, the following code creates three files:
options nodate printerpath=svgview papersize=("6" "6");
ods html close;
ods printer newfile=page;
proc sgplot data=sashelp.stocks (where=(date >= "01jan2000"d
                                 and date <= "01jan2001"d
                                 and stock = "IBM"));
   title "Stock Volume vs. Close";
   vbar date / response=volume;
   vline date / response=close y2axis;
run;
title;
proc sgplot data=sashelp.stocks
  (where=(date >= "01jan2000"d and stock = "IBM"));
  title "Stock Trend";
  series x=date y=close;
  series x=date y=low;
  series x=date y=high;
run;
title;
title "Stock High, Low, and Close";
proc sgplot data=sashelp.stocks;
  where Date >= '01JAN2005'd and stock='IBM';
  highlow x=date high=high low=low
    / close=close;
run;
title;
ods printer close;
ods html;
For information about
the NEWFILE= option, see ODS PRINTER Statement in SAS Output Delivery System: User's Guide.
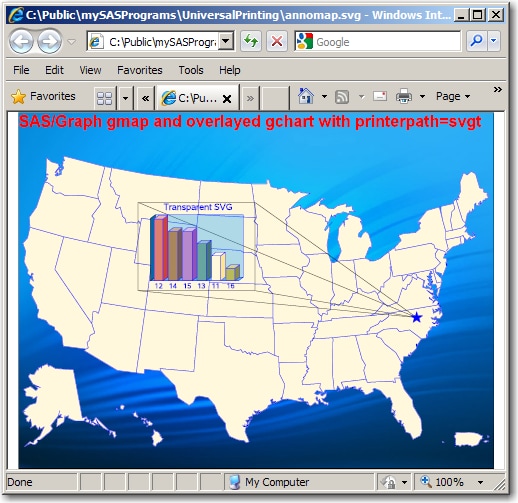
Creating Overlaid Transparent SVG Documents
You use the SVTt universal printer to create a transparent SVG
document in which the pages are transparent and can be overlaid. The
following is a SAS program that overlays a bar chart on a map of the
United States:
data boxanno;
   length function color style $20 text $16;
   retain xsys ysys '2' hsys '3' when 'a';
   set maps.uscity(keep=x y city state);
      where city='Raleigh' and state=stfips('NC');
   color='blue'; size=4; text='V'; position='5'; style='marker'; output;
   myx=x;
   myy=y;
   function='move';
    x=myx; y=myy; output;
   function='draw';
    x=myx-.432; y=myy+.0417; color='black'; line=1; size=.2; style='solid'; output;
   function='move';
    x=myx; y=myy; output;
   function='draw';
    x=myx-.432; y=myy+.178; output;
   function='move';
    x=myx; y=myy; output;
   function='draw';
    x=myx-.251; y=myy+.178; output;
   function='move';
    x=myx; y=myy; output;
   function='draw';
    x=myx-.251; y=myy+.0417; output;

run;

%let name=annomap;
filename odsout '.';

goptions reset=all;
/* Close the HTML and LISTING destinations for map creation. */
ods html close;
ods listing close;
options  printerpath=svgt nodate nonumber;
ods printer file='annomap.svg' ;


goptions border;

goptions gunit=pct htitle=3 htext=2 ftext="arial/bo"
         iback='c:\public\mySASPrograms\ripple.jpg';
pattern1 v=s c=cornsilk;

title1 c=red "SAS/Graph gmap and Overlayed gchart with printerpath=svgt";
proc gmap data=maps.us map=maps.us ;
id state;
choro state / levels=1 nolegend coutline=blue anno=boxanno
 des="" name="&name";
run;

quit;


goptions iback= hsize=2.07 vsize=1.57 horigin=2.1 vorigin=3.12 autosize=on dev=svgt;

/* you must use the default ods style, for transparency to work */

goptions gunit=pct  htext=8 ftext="Albany AMT" ;
title c=blue h=10 'Transparent SVG';
*pattern1 v=s c=red;
axis1 label=none value=none major=none minor=none style=0;
axis2 color=blue label=none offset=(7,7) value=(color=blue);
proc gchart data=sashelp.class;
   vbar3d age / discrete  patternid=midpoint
   descending raxis=axis1 maxis=axis2 width=9 space=5
   frame cframe=rgba0195FF50 coutline=blue woutline=1
   des="" name="&name.b";
run;

quit;

ods printer close;
See Enhancing Drill-Down Behavior in SVG Presentations Using HTML Attributes in SAS/GRAPH: Reference
for an example of using overlaid images for drill-down links in graphs.
SVG Documents in HTML Files
Overview of SVG Documents in HTML Files
To view an SVG document
in an HTML file, you embed the SVG document in the HTML file in one
of the following ways:
This section describes
how to embed an SVG documents in an HTML file when you create the
SVG document using the ODS PRINTER statement and the PRINTERPATH=SVG
option. For information about
creating SVG document in SAS/GRAPH, see Generating Static Graphics in SAS/GRAPH: Reference.
Embedding SVG Documents in HTML Files
When you embed SVG documents
in an HTML file, the height and width attributes of the <EMBED>
tag become the dimensions of the viewport. If you use the default
values for the SVG system options when you create your SVG document,
the SVG document scales to the size of the viewport. This is because
there is no default value of the SVGHEIGHT= and SVGWIDTH= system options,
which effectively equates to specifying a value of 100%. A value of
100% for these system options scales the SVG document to 100% of the
viewport.
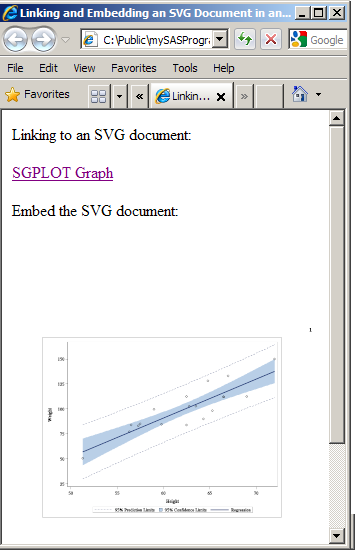
An Example HTML File That Links and Embeds a Stand-alone SVG Document
The following simple
HTML file links and embeds the SGPlot Graph SVG document:
<!DOCTYPE HTML PUBLIC “-//W3C//DTD HTML 4.01 Transitional//EN”>
<html>
<head>
   <title>Linking and Embedding an SVG Document in an HTML Document</title>
</head>
<body>
<p>Linking to an SVG document:</p>
<a href="sasprt.svg">SGPlot Graph</a>
<p>Embed the SVG document:</p>
<embed src="sasprt.svg" type="image/svg+xml" height="400" width="300">
</body>
</html>
Microsoft Internet Explorer
with the Adobe SVG Viewer 3 displays the HTML documents with the link
and the embedded SVG document: