Producing Maps
Overview of Mapping
The GMAP procedure produces
maps that display values or attributes related to areas on the map.
The procedure can produce the following types of maps:
The procedure can summarize
data that vary by physical area, show trends and variations of data
between geographic areas, and highlight regional differences or extremes.
Options for controlling
the appearance of maps include specifying the boundary density and
controlling numeric ranges and categories. You can specify patterns,
legends, and ODS styles. You can also use the SAS/GRAPH annotation
feature to annotate graphs.
For more information
and procedure syntax, see GMAP Procedure.
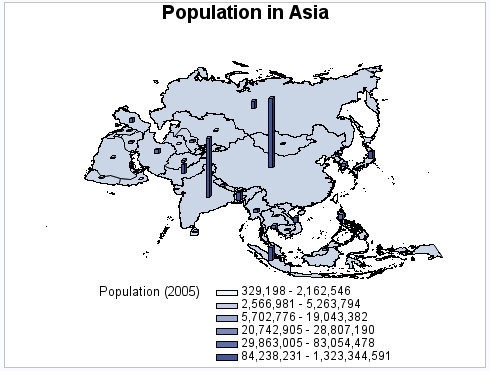
Block Maps
Block maps are three-dimensional
maps that represent data values as blocks of varying height rising
from the middle of the map areas.
See GMAP Procedure for a complete
description.
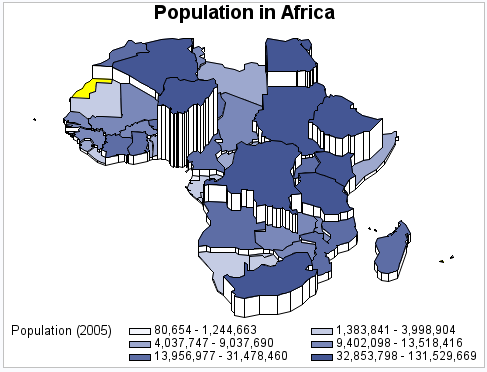
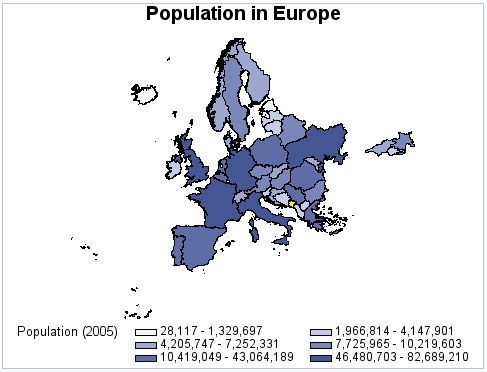
Choropleth Maps
Choropleth maps are
two-dimensional maps that display data values by filling map areas
with combinations of patterns and color that represent the data values.
See GMAP Procedure for a complete
description.
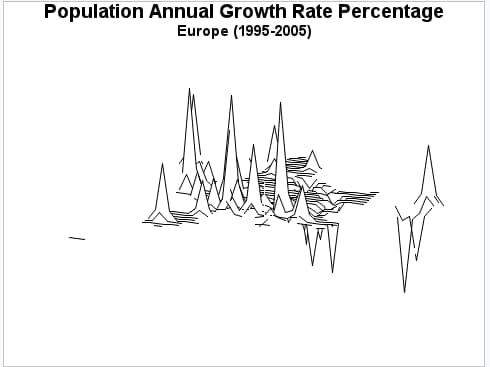
Prism Maps
Prism maps are three-dimensional
maps that display data by raising the map areas and filling them with
combinations of patterns and colors.
See GMAP Procedure for a complete
description.