Creating Text Slide and Presentation Graphics
Creating Slide Presentations
Text Slides
Use the GSLIDE procedure
to create text slides. You can specify a variety of colors, fonts,
sizes, angles, overlays, and other modifications as well as drawing
lines and boxes on the output.
See GSLIDE Procedure for a complete
description.
Combining Output into One Slide
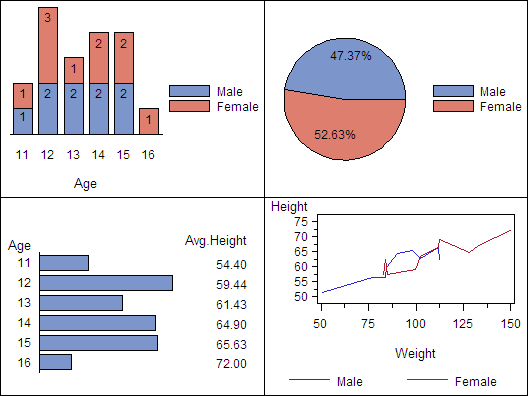
Use the GREPLAY procedure
to combine several graphs into a single output. You can create special
effects by overlaying or rotating the graphs at any angle.
Templated graphs display two or more graphs or text
slides as one output by replaying stored graphs into a template or
framework. Like graphs and text slides, templated graphs can be ordered
in groups and stored in catalogs for replay as part of a presentation.
In addition, you can
use the GREPLAY procedure to create an automated or user-controlled
presentation of graphics output. The GREPLAY procedure enables you
to name, arrange, and customize the presentation of graphs that are
stored in a catalog.
See GREPLAY Procedure for a complete
description.