Producing Three-Dimensional Plots
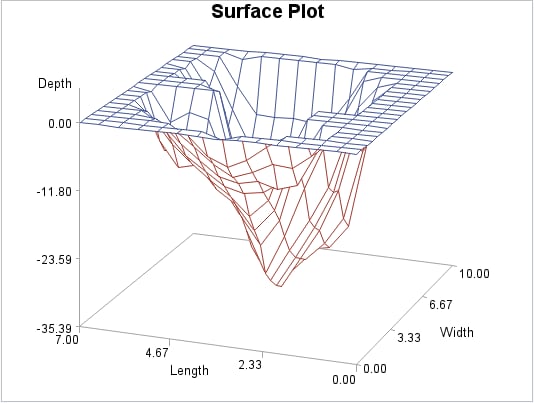
Surface Plots
Surface plots are three-dimensional
plots that display the relationship of three variables as a continuous
surface. Surface plots examine the three-dimensional shape of data.
See G3D Procedure for a complete
description.
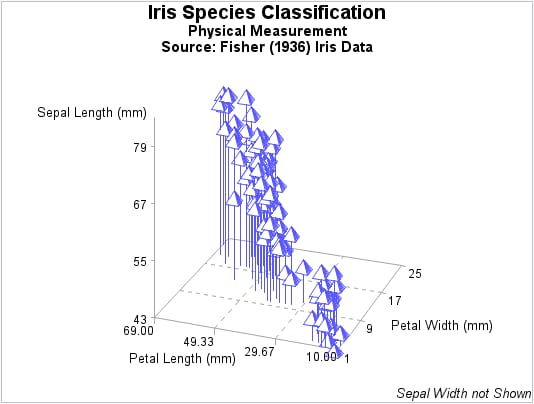
Scatter Plots
Scatter plots enable
you to examine three-dimensional data points instead of surfaces and
to classify your data using size, color, shape, or a combination of
these features.
See G3D Procedure for a complete
description.
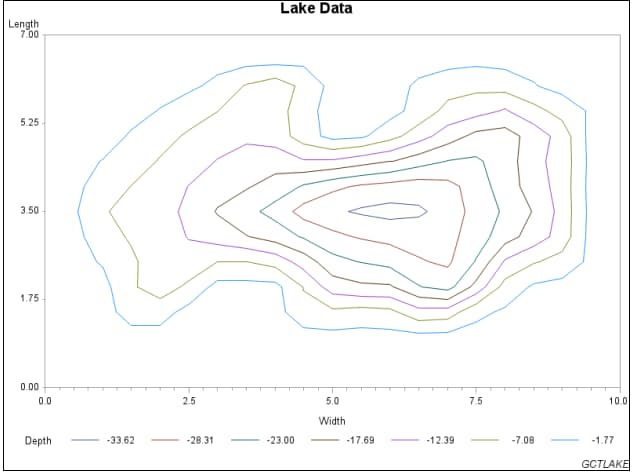
Contour Plots
See GCONTOUR Procedure for a complete
description.
Contour plots are two-dimensional
plots that show three-dimensional relationships. These plots use
contour lines or patterns to represent levels of magnitude of a contour
variable plotted on the horizontal and vertical axes.
When you need to interpolate
or smooth data values that are used by the G3D and GCONTOUR procedures,
use the G3GRID procedure. The G3GRID procedure does not produce graphics
output. Instead, it processes existing data sets to create data sets
that the G3D or GCONTOUR procedure can use to produce three-dimensional
surface or contour plots.
See G3GRID Procedure for a complete
description.