AXIS Statement
| Used by: | GBARLINE, GCHART, GCONTOUR, GPLOT, GRADAR, G3D |
| Type: | Global |
| Restrictions: | For the G3D procedure, the AXIS statement is supported
by the JAVA and ActiveX devices only.
For the GCHART procedure, the AXIS statement and its options are ignored when used in conjunction with the BLOCK statement. |
Syntax
Summary of Optional Arguments
Optional Arguments
- COLOR=axis-color
- specifies the color for all axis components (the
axis line, all tick marks, the frame outline, and all text) unless
you include a more explicit AXIS statement color specification. The following table
lists the
SAS/GRAPH -
the CTEXT= graphics option in a GOPTIONS statement
-
the color of all axis components is the color of the default style
Alias: C= -
- INTERVAL=EVEN | UNEVEN | PARTIAL
- The INTERVAL option affects the LOGBASE option in
the AXIS statement. Specifying the options
INTERVAL=UNEVEN and LOGBASE=10 permits non-base-10 values to be specified
for the ORDER option, while retaining a logarithmic scale for the
axis.Restriction: Not supported by Java and ActiveXNote:PARTIAL is an alias for UNEVEN. They have the same effect.
- LABEL=(text-argument(s)) | NONE
- modifies an axis label. Text-argument(s) defines
the appearance or the text of an axis label, or both. NONE suppresses
the axis label. Text-argument(s) can
be one or more of these:
- “text-string”
-
provides up to 256 characters of label text. By default, the text of the axis label is either the variable name or a previously assigned variable label. Enclose each string in quotation marks. Separate multiple strings with blanks.In addition, if you have a BY statement and you specify the variable that it names, you can embed one or both of the following in the string:
- #BYVALn | #BYVAL(BY-variable-name)
-
substitutes the current value of the specified BY variable for #BYVAL in the text string and displays the value produced by the statement. Specify the variable with one of these:
- #BYVARn | #BYVAR(BY-variable-name)
-
substitutes the name of the BY variable or label associated with the variable (whatever the BY line would normally display) for #BYVAR in the text string and displays the name or label produced by the statement. Specify the variable with one of these:
- n
-
specifies which variable in the BY statement #BYVAR should use. The value of n indicates the position of the variable in the BY statement. For example, #BYVAR2 specifies the second variable in the BY statement.
- BY-variable-name
-
names the BY variable. For example, #BYVAR(SITES) specifies the BY variable, SITES. Variable-name is not case sensitive.
Note:A BY variable name displayed is always in uppercase. If a label is used, it appears as specified in the LABEL statement.
- text-description-suboption
-
modifies a characteristic such as the font, color, or size of the text string(s) that follows it. Text-description-suboption can be any of the following:See Text Description Suboptions for a complete description of these suboptions.
Specify as many text strings and text description suboptions as you want, but enclose them all in one set of parentheses.Style reference:Color attribute of the GraphLabelText style elementRestrictions:Partially supported by Java and ActiveX#BYVAL or #BYVAR substitution in a text string is not available in the DATA Step Graphics Interface or in the Annotate facility. This is because BY lines are not created in a DATA step.
- LENGTH=axis length <units >
- specifies the length of the axis in number of units. If you request a length
that cannot fit the display, a warning message is written to the log
and your graph might produce unexpected results.Style reference:Color attribute of the GraphLabelText graph elementRestrictions:Not supported by the GRADAR Procedure
Not supported by Java
Examples:Specifying Logarithmic Axes
- LOGBASE=base | E | PI
- scales the axis values logarithmically according
to the value specified. Base must
be greater than 1. The number of minor tick marks is a function of
the logbase, and is calculated as the logbase minus 2. For example,
if logbase=10, there are 8 minor tick marks. If logbase=2, then there
are no minor tick marks. Because the value of logbase=e (2.718281828)
is so close to 2, it also results in no minor tick marks. How the
values are displayed on the axis depends on the LOGSTYLE= option. For example, LOGBASE=10
with the default LOGSTYLE=EXPAND generates an axis like the one in Axis Generated with LOGBASE=10 and LOGSTYLE=EXPAND.
Restrictions:Not supported by the GRADAR Procedure
Not supported by Java
When the device specified is ActiveX and LOGBASE=10, formats such as percentage are not applied to the axis values
Example:Specifying Logarithmic Axes
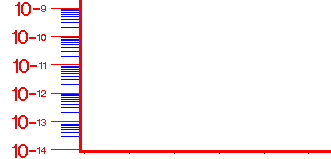
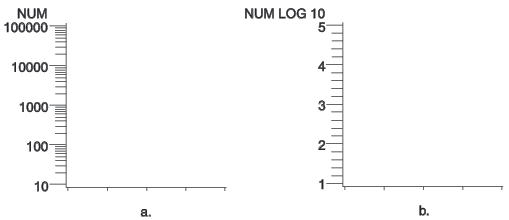
- LOGSTYLE=EXPAND | POWER
- specifies whether the values displayed on the logarithmic
axis are the values of the base or the values of the power. The LOGSTYLE= option
is meaningful only when you use the LOGBASE= option.LOGSTYLE=EXPAND specifies that the values displayed are the values of the base raised to successive powers and that the minor tick marks are logarithmically placed. For example, if the base is 10, the values displayed are 10, 100, 1000, 10000, and so on. The default is LOGSTYLE=EXPAND. This statement generates an axis like the one in part (a) of Axes Generated with the LOGSTYLE=option:
axis logbase=10 logstyle=expand;
LOGSTYLE=POWER specifies that the values displayed are the powers to which the base is raised (for example, 1, 2, 3, 4, 5, and so on). For example, this statement generates an axis like the one in part (b) of Axes Generated with the LOGSTYLE=option:axis logbase=10 logstyle=power;
If you use the ORDER= option with a logarithmic axis, the values specified by the ORDER= option must match the style specified by the LOGSTYLE= option. For example, if you specify a logarithmic axis with a base of 2 and you want to display the first five expanded values, use this statement:axis logbase=2 logstyle=expand order=(2 4 8 16 32);If you use LOGSTYLE=POWER, the values in the ORDER= option must represent the powers to which the base is raised, as in this example:axis logbase=2 logstyle=power order=(1 2 3 4 5);
If the values that are specified by ORDER= do not match the type of values specified by LOGSTYLE=, the request for a logarithmic axis is ignored.Restrictions:Not supported by the GRADAR ProcedureNot supported by Java
Example:Specifying Logarithmic Axes
- MAJOR=(tick-mark-suboption(s) ) | NONE
- modifies the major tick marks. Tick-mark-suboption(s) defines
the color, size, and number of the major tick marks. NONE suppresses
all major tick marks, although the values represented by those tick
marks are still displayed. List all suboptions and their values within
one set of parentheses.Tick-mark-suboption can
be the following:
Restrictions:Partially supported by Java and ActiveX. HEIGHT is not supported by Java or ActiveX. WIDTH is not supported by Java.
AXIS definitions assigned to the group axis of a bar chart by the GAXIS= option ignore MAJOR= because the axis does not use tick marks.
AXIS definitions assigned to the group axis of a block chart ignore MAJOR= because the grid does not use either axes or tick marks.
Note:By default, tick marks are placed at three intervals on the spokes of a GRADAR chart. They are placed at the minimum value, maximum value, and at one value in between. The tick marks on the 12 o'clock spoke are also labeled by default.See:Tick Mark Description Suboptions for complete descriptions
- MINOR=(tick-mark-suboption(s) ) | NONE
- modifies the minor tick marks that appear between
major tick marks. Tick-mark-suboption(s) defines
the color, number, or size of the minor tick marks. NONE suppresses
all minor tick marks. List all suboptions and their values within
one set of parentheses. Tick-mark-suboption can
be the following:
Restrictions:Partially supported by Java and ActiveX. HEIGHT is not supported by Java or ActiveX.
Not supported by the GRADAR Procedure
AXIS definitions assigned to the group axis of a bar chart by the GAXIS= option ignore MINOR= because the axis does not use tick marks.
AXIS definitions assigned to the group axis of a block chart ignore MINOR= because the grid does not use either axes or tick marks.
See:Tick Mark Description Suboptions for complete descriptions
- NOBRACKETS
- suppresses the printing of group brackets drawn
around the values on the group axis in a bar chart. NOBRACKETS applies
only to the group axis of bar charts.Restrictions:Not supported by Java and ActiveX
Not supported by the GRADAR Procedure
- NOPLANE
- removes either the horizontal or vertical three-dimensional
axis plane in bar charts produced by the HBAR3D and VBAR3D statements. NOPLANE affects only
the axis to which the AXIS statement applies.To remove selected axis elements such as lines, values or labels, use specific AXIS statement options. To remove all axis elements except the three-dimensional planes use the NOAXIS option in the procedure. To remove the three-dimensional back wall, use the NOFRAME option in the procedure.Restriction:Not supported by the GRADAR Procedure
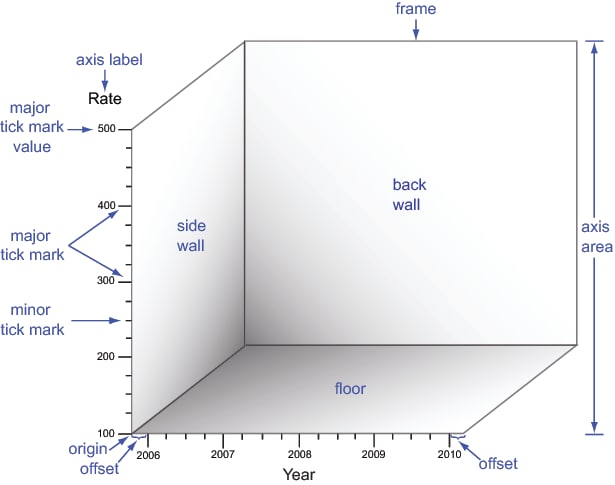
- OFFSET=(<n1><,n2>)<units > | (<n1<units>><,n2<units>>)
- specifies the distance from the first and last major
tick marks or bars to the ends of the axis line. The value of (n1)
is the distance from the beginning (origin) of the axis line to the
first tick mark or middle of the first bar. The value of (n2)
is the distance from the end of the axis line to the last tick mark
or middle of the last bar.On a horizontal axis, the (n1) offset is measured from the left end of the axis line and the (n2) offset is measured from the right end. On a vertical axis, the (n1) offset is measured up from the bottom of the axis line and the (n2) offset is measured down from the top of the line.To specify the same offset for both n1 and n2, use one value, with or without a following comma. For example, either option sets both n1 and n2 to 4 centimeters:
offset=(4 cm)
offset=(4 cm,)
To specify different offsets, use two values, with or without a comma separating them. For example:offset=(4 cm, 2 cm)
To specify only the second offset, use only one value preceded by a comma. This option offsets the last major tick mark or bar three centimeters from the right-hand end of the axis line:offset=(,3 cm)
Restrictions:Not supported by JavaNot supported by the GRADAR procedure
- ORDER=(value-list )
- specifies the order in which data values appear
on the axis. The values specified
by the ORDER= option are the major tick mark values. You can modify
the appearance of these values with the VALUE= option.
- value-list
-
For numeric variables, value-list is either an explicit list of values or a starting and an ending value with an interval increment, or a combination of both forms:If a numeric variable has an associated format, the specified values must be the unformatted values.Values must be listed in either ascending or descending order. By default the increment value is 1. You can use a negative integer for increment to specify a value list in descending order. In all forms, multiple n values can be separated by blanks or commas. Here are some examples:
order=(2 4 6)
order=(6,4,2)
order=(2 to 10 by 2)
order=(50 to 10 by -5)
order=(0 to 4 by 1, 5 to 19 by 2)
- value-list
-
For character variables, value-list is a list of unique character values enclosed in quotation marks and separated by blanks:If a character variable has an associated format, the specified values must be the formatted values for PROC GCHART and the unformatted values for PROC GPLOT.
- value-list
-
For date and time values, value-list can have the following forms:
- “SAS-value”i
-
is any SAS date, time, or datetime value described for the SAS functions INTCK and INTNX. Enclose the value in quotation marks and specify one of the following for i:
- interval
-
is one of the valid arguments for the INTCK or INTNX functions. These are the default intervals:
These value lists use SAS date and time values:order=("25MAY11"d "04JUL11"d "07SEP11"d) order=("01JUL10"d to "01AUG10"d) order=("01JUL11"d to "01JAN11"d by week) order=("9:25"t to "11:25"t by minute) order=("04JUN11:12:00:00"dt to "10JUN11:12:00:00"dt by dtday)With SAS date and time values, use a FORMAT statement so that the tick mark values have an understandable form. For more information about SAS date and time values, see the Formats by Category in SAS Formats and Informats: Reference.
With any type of value-list, specifying values that are not distributed uniformly or are not in ascending or descending order, generates a warning message in the SAS log. The specified values are spaced evenly along the axis even if the values are not distributed uniformly.Using the ORDER= option to restrict the values displayed on the axis can result in clipping. For example, if the data range is 1 to 10 and you specify ORDER=(3 TO 5), only the data values from 3 to 5 appear on the plot or chart. For charts, the omitted values are still included in the statistic calculation.Using the ORDER= option to specify non-uniform intervals for major tick marks can result in no minor tick marks being drawn. It also generates a warning message in the SAS log.CAUTION:The ORDER= option does not calculate midpoint values. As a result, it is not interchangeable with the MIDPOINTS= option in the GCHART procedure.You can use the ORDER= option to specify the order in which the midpoints are displayed on a chart, but do not use it to calculate midpoint values. Make sure that the values that you specify match the midpoint values that are calculated either by default by the GCHART procedure or by the MIDPOINTS= option. For details, see the description of the MIDPOINTS= option for the appropriate statement in GCHART Procedure.Restrictions:The Java applet supports the ORDER= option for uniform numeric axes, but does not support the ORDER= option for categorical, character, midpoint, or group axes. The Java applet does not support non-uniform interval values. If you specify such values, the Java applet outputs only the minimum and maximum values along with an even spacing of the number of tick marks specified between those values. For example, this non-uniform value list produces a minimum value of 0 and a maximum value of 50. It also produces a total of 4 evenly spaced tick marks with values 0, 16.67, 33.34, and 50:ORDER=(0 20 30 50)
Not valid with the ASCENDING, DESCENDING, and NOZEROS options used with the bar chart statements in the GCHART procedure.
Interaction:The ORDER= option overrides the suboption NUMBER= described in Tick Mark Description Suboptions.Note:The ActiveX control supports simple order lists and non-uniform interval values for numerical data and dates.
- ORIGIN=(<x><,y>)<units> | (<x<units>><,y<units>>)
- specifies the x coordinate
and the y coordinate of the
origin of the axis. The origin of the horizontal
axis is the left end of the axis, and the origin of the vertical axis
is the bottom of the axis. The ORIGIN= option explicitly positions
the axis anywhere on the graphics output area.If you specify only one value, with or without a comma following it, only the x coordinate is set to that value. For example, this specification sets x to 4 centimeters:
origin=(4 cm,)
If you specify two values, with or without a comma separating them, the first value sets the x coordinate and the second value sets the y coordinate:origin=(2 pct, 4 pct)
If you specify one value preceded by a comma, only the y coordinate is set to that value, as shown here:origin=(,3 pct)
Restrictions:Not supported by Java and ActiveXNot supported by the GRADAR procedure
- REFLABEL=(text-argument(s)) | NONE
- creates and defines the appearance of a reference-line
label. Text-argument(s) defines
the appearance or the text of the label, or both. NONE suppresses
the reference-line label. Text-argument(s) can
be one or more of these:
- “text-string”
-
provides up to 256 characters of label text. By default, a reference line does not have a label. Enclose each string in quotation marks. Separate multiple strings with blank spaces. The strings are applied to the reference lines specified by the VREF or HREF option.In addition, if you have a BY statement and you specify the variable that it names, you can embed one or both of the following in the string:
- #BYVALn | #BYVAL(BY-variable-name)
-
substitutes the current value of the specified BY variable for #BYVAL in the text string and displays the value produced by the statement. Specify the variable with one of these:
- #BYVARn | #BYVAR(BY-variable-name)
-
substitutes the name of the BY variable or label associated with the variable (whatever the BY line would normally display) for #BYVAR in the text string and displays the name or label produced by the statement. Specify the variable with one of these:
- n
-
specifies which variable in the BY statement #BYVAR should use. The value of n indicates the position of the variable in the BY statement. For example, #BYVAR2 specifies the second variable in the BY statement.
- BY-variable-name
-
names the BY variable. For example, #BYVAR(SITES) specifies the BY variable, SITES. Variable-name is not case sensitive.
Note:A BY variable name displayed is always in uppercase. If a label is used, it appears as specified in the LABEL statement.
- text-description-suboption
-
modifies a characteristic such as the font, color, or size of the text string(s) that follows it. Text-description-suboption can be the following:See Text Description Suboptions for a complete description of these suboptions.
Specify as many text strings and text description suboptions as you want, but enclose them all in one set of parentheses.Style reference:Font and Color attributes of the GraphLabelText elementRestrictions:Not supported by Java and ActiveXNot supported by the GRADAR procedure
#BYVAL or #BYVAR substitution in a text string is not available in the DATA Step Graphics Interface or in the Annotate facility. The reason is that BY lines are not created in a DATA step.
- SPLIT=“split-char(s)”
- specifies one or more characters that the AXIS statement
uses to break axis values into multiple lines. Split-char(s) can
be any character value that can be specified in a SAS character variable.
Do not delimit when specifying multiple split characters. Each split
character must be embedded in the variable values in the data set
or sets, or in an associated format. When the AXIS statement encounters
the split character, it automatically breaks the value at that point
and continues on the next line. For example, suppose the data set
contains the value
Berlin, Germany/Europe, and you specify SPLIT=“,/”. The value would appear on the axis as follows:Berlin Germany Europe
If the AXIS statement does not encounter a specified split character, no break in the variable value occurs, and no warning or error is issued.Axis values specified with VALUE= do not use the split character. For example, suppose you specify this statement:axis1 split="," value=(tick=1 "December, 1999");
The value appears on the axis on one line asDecember, 1999. However, any other axis values containing a comma honors the split character.Restrictions:Not supported by Java and ActiveXNot supported by the GRADAR procedure
Up to 31 split characters are supported. If you specify more than 31 characters, only the first 31 are honored.
Note:The split characters themselves are not displayed.
- STAGGER
- offsets the axis values on a horizontal axis. This option is useful when values overlap on an axis. When specifying the Java and ActiveX devices, the STAGGER option must sometimes be used in conjunction with the ORDER statement.
- STYLE=line-type
- specifies a line type for the axis line. Valid values for line-type are
0 through 46. If you specify STYLE=0, the axis line is not drawn.
The default is 1, a solid line.Style reference:Line style attribute of the GraphAxisLine elementInteractions:In order for the axis line to be altered by the STYLE= option, the NOFRAME option must also be set. If only the STYLE=option is set, the line framing the axis area is modified.
When specifying both the STYLE= and WIDTH= suboptions, only the WIDTH= specification is used, resulting in a modification to the tick mark thickness but not the axis line type
Using the PNG device with STYLE= results in the specified line type being applied to the line framing the axis area
See:Line Types for examples of the available line types
- VALUE=(text-argument(s) ) | NONE
- modifies the major tick mark values. That is, this option
modifies the text that labels the major tick marks on the axis. Text-argument(s) defines
the appearance or the text of a major tick mark value, or both. NONE
suppresses the major tick mark values, although the major tick marks
are still displayed.Text-argument(s) can
be one or more of these:
- “text-string”
-
provides up to 256 characters of text for the major tick mark value. By default, the value is either the variable value or an associated format value. Enclose each string in quotation marks and separate multiple strings with blanks.Specified text strings are assigned to major tick marks in order. If you specify only one text string, only the first tick mark value changes, and all the other tick mark values display the default. If you specify multiple strings, the first string is the value of the first major tick mark. The second string is the value of the second major tick mark, and so on. For example, to change default tick mark values 1, 2, and 3 to
First,Second, andThird, use this option:value=("First" "Second" "Third")Note: Although the VALUE= option changes the text displayed at a major tick mark, it does not affect the actual value represented by the tick mark. To change the tick mark values, use the ORDER= option. Also note that with the Java or ActiveX devices, it is necessary to use the ORDER= option. This ensures that the same number of tick marks are displayed as are with graphics rendered with the other device drivers. For example, specify ORDER=(1 to 12) to ensure that tick marks for all twelve months are displayed.Note: To change the value of midpoints in bar charts produced with the GCHART procedure, use the MIDPOINTS= option in the procedure.In addition, if you have a BY statement and you specify the variable that it names, you can embed one or both of the following in the string:- #BYVALn | #BYVAL(BY-variable-name)
-
substitutes the current value of the specified BY variable for #BYVAL in the text string and displays the value produced by the statement. Specify the variable with one of these:
- #BYVARn | #BYVAR(BY-variable-name)
-
substitutes the name of the BY variable or label associated with the variable (whatever the BY line would normally display) for #BYVAR in the text string and displays the name or label produced by the statement. Specify the variable with one of these:
- n
-
specifies which variable in the BY statement #BYVAR should use. The value of n indicates the position of the variable in the BY statement. For example, #BYVAR2 specifies the second variable in the BY statement.
- BY-variable-name
-
names the BY variable. For example, #BYVAR(SITES) specifies the BY variable, SITES. Variable-name is not case sensitive.
Note:A BY variable name displayed is always in uppercase. If a label is used, it appears as specified in the LABEL statement.
- text-description-suboption
-
modifies a characteristic such as the font, color, or size of the text string(s) that follows it. Text-description-suboption can be the following:Specify as many text strings and text description suboptions as you want, but enclose them all in one set of parentheses.For a complete description of these suboptions, see Text Description Suboptions.
Style reference:Color attribute of the GraphLabelText graph elementRestrictions:Partially supported by JavaPlace text description suboptions before the text strings that they modify. Suboptions not followed by a text string affect the default values. To specify and describe the text for individual values or to produce multi-line text, use the TICK= suboption.
#BYVAL or #BYVAR substitution in a text string is not available in the DATA Step Graphics Interface or in the Annotate facility. The reason is that BY lines are not created in a DATA step.
Interaction:This option, with any of its specified suboptions, overrides the RANGE= option when creating vertical bar charts, as with the GBARLINE and GCHART procedures. This is noted in the log as follows:NOTE: Axis value is specified. RANGE option is ignored.
Note:If an end user viewing a graph in the Java applet or ActiveX control zooms in on a particular part of a graph for which the VALUE= option is specified, the values are not readjusted in coordination with the zooming.Examples:Specifying Logarithmic Axes
- WIDTH=thickness-factor
- specifies the thickness of the axis line. Thickness increases
directly with the value of thickness-factor.
By default, WIDTH=1.Style reference:LineThickness attribute of the GraphAxisLines elementRestriction:Not supported by JavaInteractions:In order for the axis line to be altered by the WIDTH= option, the NOFRAME option must also be set. If only the WIDTH= option is set, the line framing the axis area is modified
When specifying both the STYLE= and WIDTH= suboptions, only the WIDTH= specification is used, resulting in a modification to the tick mark thickness but not the axis line type
Text Description Suboptions
- ANGLE=degrees
-
specifies the angle of the baseline with respect to the horizontal. A positive value for degrees moves the baseline counterclockwise; a negative value moves it clockwise. By default, ANGLE=0 (horizontal) unless the text is automatically angled or rotated to avoid overlapping.Note: Changing the angle of a vertical axis-label can result in the label being positioned above the graph when using the Java or ActiveX device drivers.Alias:A=Restrictions:You cannot justify angled text that is used to describe tick marks on a horizontal axis; the JUSTIFY= suboption is not honored when the ANGLE= value is anything other than zero.
Partially supported by Java
See: ROTATE=degrees
- AUTOREF
- automatically labels each reference line on an axis
with the response value at the reference line's position. The AUTOREF suboption
is used only with the REFLABEL= option,
and can be used in conjunction with the FORMAT= suboption to refine
the labels. When the FORMAT= suboption applies a valid format to a
response variable value, AUTOREF displays those formatted values as
the reference line labels. When the FORMAT= suboption is omitted,
AUTOREF displays (as
reference line labels) the
response variable values as is.The automatic labels are applied only to reference lines that do not have specific labels assigned to them. For example, the following option uses the response-axis value as the label for every reference line except the second reference line, which is assigned the label two:
reflabel=(autoref t=2 "two")
Note: If you simultaneously request automatic labeling with a PLOT or BUBBLE statement (using the AUTOHREF or AUTOVREF option), then the automatic labeling can write on top of the custom label that you specified using the AXIS statement. You must ensure that your custom labels specified using the AXIS statement are not at the same position as automatic labels requested with a different statement.Restriction: Not supported by Java and ActiveX
- COLOR=text-color
-
specifies the color for the text. If you omit the COLOR= suboption, a color specification is searched for in this order:
-
the CTEXT= option for the procedure
-
the CTEXT= option in a GOPTIONS statement
-
the color of the default style
Alias: C= -
- FONT=font | NONE
-
specifies the font for the text. See Specifying Fonts in SAS/GRAPH Programs for details about specifying font. If you omit the FONT= option, a font specification is searched for in this order:
-
the FTEXT= option in a GOPTIONS statement
-
the default style font, NONE
If you use a device-resident font for your midpoint axis labels and one or more of the axis labels overlap the legend in your graph, the device-resident font for each label that overlaps the legend is replaced with aSAS/GRAPH SAS/GRAPH Alias:F=Restriction: Partially supported by Java -
- FORMAT=’ValidFormat’
- specifies a valid format to be applied to the response-axis
value shown with the AUTOREF label on each reference line. This suboption allows
for the character or numeric formatting of x-axis and y-axis variable
values. The FORMAT= suboption of the REFLABEL option controls the
display of different values at the reference lines relating to conversion
rates, scales, and the like. If an invalid format is specified, then
a warning message is issued and the resulting labels have response-axis
values with no formatting. When FORMAT= is omitted, the default reverts
to the AUTOREF suboption behavior of producing labels automatically
with unformatted response-axis values.Restrictions:Must be used with the AUTOREF suboption of the REFLABEL option.
Formatting might accommodate response-axis variable values that are up to 256 characters in length.
Not supported by Java and ActiveX
Note:Although the AUTOREF suboption ignores any format assigned to an x- or y-axis variable with the FORMAT statement, the FORMAT= suboption provides a way to format each response-axis variable value.See: AUTOREF
- HEIGHT=text-height <units >
-
specifies the height of the text characters in number of units. By default, HEIGHT=1 CELL. If you omit the HEIGHT= option, a text height specification is searched for in this order:
-
the HTEXT= option in a GOPTIONS statement
-
the default style value, 1
Alias: H= -
- JUSTIFY=LEFT | CENTER | RIGHT
-
specifies the alignment of the text. The default depends on the option with which it is used and the text that it applies to.
-
-
For a reference line that intersects a horizontal axis, the default is JUSTIFY=RIGHT for all procedures except the BAR statement in GBARLINE. For the BAR statement in GBARLINE the default is JUSTIFY=LEFT. RIGHT places the text string just to the right of the line. CENTER centers the text string on top of the line. LEFT places the text string just to the left of the line.
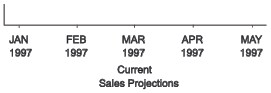
You can use the JUSTIFY= option to print multiple lines of text by repeating the JUSTIFY= option before the text string for each line. You can also use JUSTIFY= to specify multi-line text at specified major tick marks. For example, this statement produces an axis label and major tick mark values like those shown in The JUSTIFY= suboption.axis label=("Current" justify=c "Sales Projections") value=(tick=1 "JAN" justify=c "1997" tick=2 "FEB" justify=c "1997" tick=3 "MAR" justify=c "1997" tick=4 "APR" justify=c "1997" tick=5 "MAY" justify=c "1997");Alias:J=L | C | RRestrictions:You cannot justify angled or rotated text that is used to describe tick marks on a horizontal axis; the JUSTIFY= suboption is not honored.Not supported by Java
Note:With output using Java and ActiveX, text justification is relative to the text string, not the tick mark. For example, left justification means that the left end of the text string is justified with respect to the drawing location, as well as other strings in a multiline label. Because the text is left-justified with respect to the drawing location and not the tick mark, the text string can be placed to the right of a tick mark.See: TICK=n
- POSITION=TOP | MIDDLE | BOTTOM
-
specifies the position of a reference-line label relative to the reference line. The default is TOP for both vertical and horizontal reference lines. The POSITION= option is available only on the REFLABEL= option.Restriction: Not supported by Java and ActiveX
- ROTATE=degrees
-
specifies the angle at which each character of text is rotated with respect to the baseline of the text string. A positive value for degree rotates the character counterclockwise; a negative value moves it clockwise. By default, ROTATE=0 (parallel to the baseline) unless the text is automatically angled or rotated to avoid overlapping.Alias: R=Restrictions:You cannot justify angled text that is used to describe tick marks on a horizontal axis; the JUSTIFY= suboption is not honored when the ROTATE= value is anything other than zero.
Partially supported by Java
See: ANGLE=degrees
- TICK=n
-
specifies the n reference line or tick mark value. Used only with the REFLABEL= option or the VALUE= option. If neither one is specified, then the TICK= option is ignored.
-
With the REFLABEL= option, the TICK= option specifies the nth reference line. It is used to limit modifications to individual reference lines when there are multiple reference lines on an axis. For example, the following option changes the color of only the third reference line's label and leaves all other reference-line labels unchanged:
reflabel=(autoref t=3 color=red)
Suboptions that precede the TICK= option affect all the reference-line labels on an axis. Suboptions that follow the TICK= option affect only the specified line's label. For example, the following option assigns the color green to all the reference-line labels on an axis, but left-justifies only the third reference line's label:reflabel(c=green "one" "two" t=3 j=left "three")
For the options to be applied to a text string, they must precede the quoted string. In the following option, thej=leftis ignored because it follows the string:reflabel(c=green "one" "two" t=3 "three" j=left)
-
With the VALUE= option, the TICK= option specifies the nth major tick mark value. It is used to designate the tick mark value whose text and appearance you want to modify. For example, the following option changes the color of only the third tick mark value and leaves all others unchanged:
value=(tick=3 color=red)
Suboptions that precede the TICK= option affect all the major tick mark values. Suboptions that follow the TICK= option affect only the specified value. For example, the following option makes all the major tick mark values four units high and colors all of them blue except for the third one, which is red:value=(height=4 color=blue tick=3 color=red)
Alias:T=Note:The Java and ActiveX device drivers do not support the REFLABEL option. -
Tick Mark Description Suboptions
- COLOR=tick-mark-color
-
colors the tick marks. If you omit the COLOR= suboption, a color specification is searched for in this order:
-
the COLOR= option in the AXIS statement
-
the CAXIS= option for the procedure
-
the color of the default style
Alias: C= -
- HEIGHT=tick-height <units>
-
specifies the height of the tick mark. The defaults for the HEIGHT= suboption depend on the option with which it is used:Alias: H=Restriction: Not supported by Java and ActiveX
- NUMBER=number-of-ticks
-
specifies the number of tick marks to be drawn. With the MAJOR= option, number-of-ticks must be greater than 1. With the MINOR= option, number-of-ticks must be greater than 0.With the MAJOR= option, the NUMBER= suboption can be overridden by a major tick mark specification in the procedure, which in turn can be overridden by the ORDER= option.With the MINOR= option, the NUMBER= suboption can be overridden by a minor tick mark specification in the procedure.Alias: N=
Details
Description: AXIS Statement
Using Text Description Suboptions
label=(font=swiss height=4 "Weight"
justify=right height=3 "(in tons)")Using the AXIS Statement
axis4;
goptions reset=axis;