Example 7: Using BY-group Processing to Generate a Series of Charts
| Features: |
BY statement OPTIONS statement options: NOBYLINE PATTERN statement options: COLOR= TITLE statement: #BYVAL |
| Sample library member: | GBYGMSC1 |
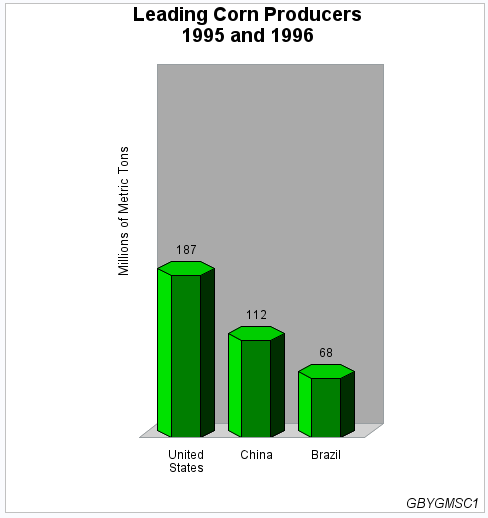
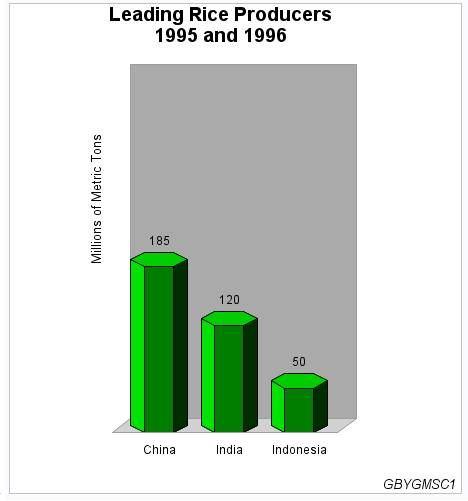
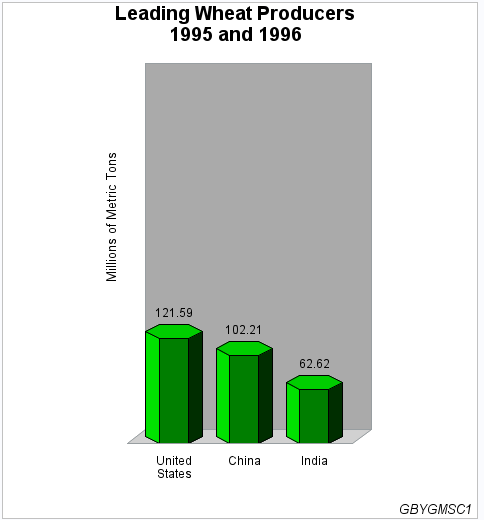
This example uses a
BY statement with the GCHART procedure to produce a separate three-dimensional
vertical bar chart for each value of the BY variable TYPE. The three charts, which
are shown in Output for BY Value Corn, Output for BY Value Rice, and Output for BY Value Wheat, show leading
grain producers for 1995 and 1996.
The program suppresses
the default BY lines and instead uses #BYVAL in the TITLE statement
text string to include the BY variable value in the title for each
chart. The AXIS1 statement that is assigned to the vertical (response)
axis is automatically applied to all three graphs generated by the
BY statement. This AXIS statement removes all the elements of the
response axis except the label. The same AXIS statement also includes
an ORDER= option. Because this option is applied to all the graphs,
it ensures that they all use the same scale of response values. Because
no subgroups are specified and the PATTERNID= option is omitted, the
color specified in the single PATTERN statement is used by all of
the bars.
Program
goptions reset=all border;
data grainldr;
   length country $ 3 type $ 5;
   input year country $ type $ amount;
   megtons=amount/1000;
   datalines;
1995 BRZ  Wheat    1516
1995 BRZ  Rice     11236
1995 BRZ  Corn     36276
1995 CHN  Wheat    102207
1995 CHN  Rice     185226
1995 CHN  Corn     112331
1995 INS  Wheat    .
1995 INS  Rice     49860
1995 INS  Corn     8223
1995 USA  Wheat    59494
1995 USA  Rice     7888
1995 USA  Corn     187300
1996 BRZ  Wheat    3302
1996 BRZ  Rice     10035
1996 BRZ  Corn     31975
1996 IND  Wheat    62620
1996 IND  Rice     120012
1996 IND  Corn     8660
1996 USA  Wheat    62099
1996 USA  Rice     7771
;
proc format;
  value $country "BRZ" = "Brazil"
                 "CHN" = "China"
                 "IND" = "India"
                 "INS" = "Indonesia"
                 "USA" = "United States";
run;
options nobyline;
title1 "Leading #byval(type) Producers"
        j=c "1995 and 1996";
footnote1 j=r  "GBYGMSC1 ";
pattern1 color=green;
axis1 order=(0 to 550 by 100)
      label=(angle=90 "Millions of Metric Tons")
      major=none
      minor=none
      value=none
      style=0
      noplane;
axis2 label=none
      split=" ";
proc sort data=grainldr out=temp;
     by type;
run;
proc gchart data=temp (where=(megtons gt 31));
   by type;
   format country $country.;
   vbar3d country / sumvar=megtons
                    outside=sum
                    descending
                    shape=hexagon
                    width=8
                    coutline=black
                    cframe=grayaa
                    maxis=axis2
                    raxis=axis1 name="GBYGMSC1";
run;
quit;
Program Description
Create the data set GRAINLDR. GRAINLDR
contains data about grain production in five countries for 1995 and
1996. The quantities in AMOUNT are in thousands of metric tons. MEGTONS
converts these quantities to millions of metric tons.
data grainldr;
   length country $ 3 type $ 5;
   input year country $ type $ amount;
   megtons=amount/1000;
   datalines;
1995 BRZ  Wheat    1516
1995 BRZ  Rice     11236
1995 BRZ  Corn     36276
1995 CHN  Wheat    102207
1995 CHN  Rice     185226
1995 CHN  Corn     112331
1995 INS  Wheat    .
1995 INS  Rice     49860
1995 INS  Corn     8223
1995 USA  Wheat    59494
1995 USA  Rice     7888
1995 USA  Corn     187300
1996 BRZ  Wheat    3302
1996 BRZ  Rice     10035
1996 BRZ  Corn     31975
1996 IND  Wheat    62620
1996 IND  Rice     120012
1996 IND  Corn     8660
1996 USA  Wheat    62099
1996 USA  Rice     7771
;
proc format;
  value $country "BRZ" = "Brazil"
                 "CHN" = "China"
                 "IND" = "India"
                 "INS" = "Indonesia"
                 "USA" = "United States";
run;
Suppress the default BY line and define a title that includes
the BY-value. #BYVAL inserts the value
of the BY variable COUNTRY into the title of each report.
options nobyline;
title1 "Leading #byval(type) Producers"
        j=c "1995 and 1996";
footnote1 j=r "GBYGMSC1 ";Define the axis characteristics for the response axes. The ORDER= option specifies the range of values
for the response axes. ANGLE=90 in the LABEL= option rotates the label
90 degrees. All the other options remove axis elements. The MAJOR=,
MINOR=, and VALUE= options remove the tick marks and values. STYLE=0
removes the line. The NOPLANE option removes the three-dimensional
plane.
axis1 order=(0 to 550 by 100)
      label=(angle=90 "Millions of Metric Tons")
      major=none
      minor=none
      value=none
      style=0
      noplane;
Define midpoint axis characteristics. The SPLIT= option defines one or more characters,
such as a blank, that the AXIS statement uses to break axis values
into multiple lines.
Sort data according to values of BY variable. The data must be sorted before running PROC GCHART
with the BY statement.