| The MDC Procedure |
| Multivariate Normal Utility Function |
Consider the following random utility function:
 |
where
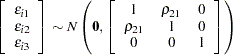 |
The correlation coefficient ( ) between
  and
and  represents common neglected attributes of public transportation modes, 1 and 2. The following SAS statements estimate this trinomial probit model:
   /*-- homoscedastic mprobit --*/
   proc mdc data=newdata;
      model decision = ttime /
               type=mprobit
               nchoice=3
               unitvariance=(1 2 3)
               covest=hess;
      id pid;
   run;
The UNITVARIANCE=(1 2 3) option specifies that the random component of utility for each of these choices have unit variance. If the UNITVARIANCE= option is specified, it needs to include at least two choices. The results of this constrained multinomial probit model estimation are displayed in Figure 17.12 and Figure 17.13. The test for ttime = 0 is rejected at the 1% significance level.
| Model Fit Summary | |
|---|---|
| Dependent Variable | decision |
| Number of Observations | 50 |
| Number of Cases | 150 |
| Log Likelihood | -33.88604 |
| Log Likelihood Null (LogL(0)) | -54.93061 |
| Maximum Absolute Gradient | 0.0002380 |
| Number of Iterations | 8 |
| Optimization Method | Dual Quasi-Newton |
| AIC | 71.77209 |
| Schwarz Criterion | 75.59613 |
| Number of Simulations | 100 |
| Starting Point of Halton Sequence | 11 |
Figure 17.13
Multinomial Probit Estimates with Unit Variances
| Parameter Estimates | |||||
|---|---|---|---|---|---|
| Parameter | DF | Estimate | Standard Error |
t Value | Approx Pr > |t| |
| ttime | 1 | -0.2307 | 0.0472 | -4.89 | <.0001 |
| RHO_21 | 1 | 0.4820 | 0.3135 | 1.54 | 0.1242 |
Copyright © 2008 by SAS Institute Inc., Cary, NC, USA. All rights reserved.