Reviewing a Successful Job
Solution
Tasks
Check the Status Tab
Click Status in
the Details section of the Job Editor window
to display the status of each step in the job. If the Details section
is not displayed, click Details in the View menu
in the SAS Data Integration Studio menu bar. The following display
shows a Status tab that confirms that all
of the steps in a sample job were completed successfully.
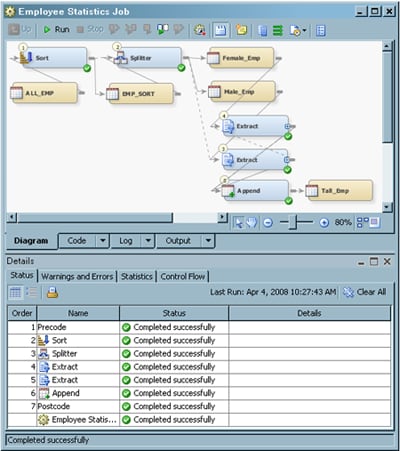
Note: The run-time status of each
node in a job is also shown on the node on the Diagram tab.
The following markers are placed on the jobs:
In addition, you can review the basic properties of
any object in the job. Click the object on the Diagram.
Then, examine the Basic Properties pane for the object.
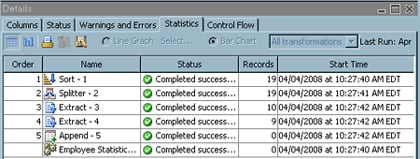
Examine the Statistics Tab
Click Statistics in
the Details section to display a tabular or graphic presentation of
statistics about the progress of the job. Click the icon for the Display
table view for the statistics tab on the Statistics toolbar
to view a table of statistics. The following display shows the table
for the sample job.
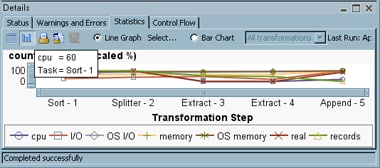
You can click the icon
for the Display graph view for the statistics tab on
the Statistics toolbar to display a graphical chart. Select Line
Graph to display a graph that charts one or more of the
following values for the job:
Click Select to
choose the values that are included in the graph. The following display
shows a line graph of the sample job.
Select Bar
Chart to display a bar chart that illustrates the process
duration of each transformation that is included in the job. Click Select to
pick a single transformation or all transformations for inclusion
in the graph. The following display shows a bar chart of the sample
job.
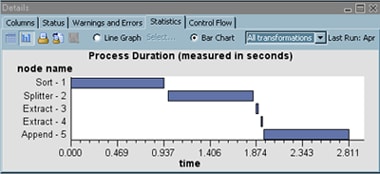
You can display a detailed
summary for a transformation by positioning the mouse pointer over
its bar.
If you do not see the
output that you expect on the Statistics tab,
then you can perform the following troubleshooting tasks:
-
When you execute jobs interactively and have run-time statistics enabled, output should be produced. If not, verify that the server is properly configured. See the "Use ARM to Display Runtime Statistics" section in the "Administering SAS Data Integration Studio" chapter of the SAS Intelligence Platform: Desktop Application Administration Guide.
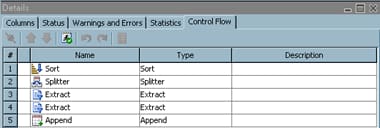
Examine the Control Flow Tab
Click Control
Flow in the Details section to access a table that consists
of the transformations that are included in the job. These transformations
are listed in the order in which they are run in the job. The following
display shows the control flow table for the sample job.
You can click Validates
the control flow to make sure that the flow is valid.
You can also drag a row to a higher or lower position in the table
by clicking on the row number and moving the row either up or down.
This action moves the transformation included in the row to a different
position in the flow; it is run in an earlier or later position.
Control order is the
order in which the nodes are run in a job. A warning in the control
flow panel can be displayed when a step is ordered to run before the
step that creates its data has run. For example, suppose there are
two steps in a job in which Step 1 creates data that Step 2 uses,
and Step 2 is ordered to run before Step 1. This arrangement forces
Step 2 to run before its data is created. Step 2 is unlikely to run
correctly because it does not have its data yet. If an out of order
scenario is detected, then a warning icon is displayed to warn users
that they might have steps out of order. However, they can still run
the steps out of order if they choose.
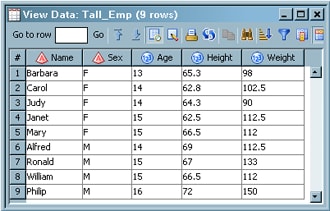
Review the Job Output
Right-click the target
table of the job. Then, click Open in the
pop-up window to see the output. The target table for the sample job
is shown in the following display.
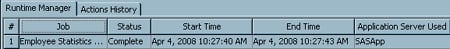
You can also review
basic details about the job in the Runtime Manager at the bottom of
the SAS Data Integration Studio window. If
the Runtime Manager is not displayed, click Runtime Manager in
the View menu in the SAS Data Integration
Studio menu bar. The Runtime Manager is shown in the following display.
Copyright © SAS Institute Inc. All rights reserved.