Transform Data in Hadoop

Example
The following example
depicts the process of creating and running a directive that contains
several transformations. The example opens a source table of customer
information, selects columns for the target, and applies two filters.
-
In the Transformation task, click a transformation:Your job can consist of one or more transformations. Multiple transformations are executed in the order in which you define them. A logical order for all three transformations is filter data, manage columns, and summarize columns.
-
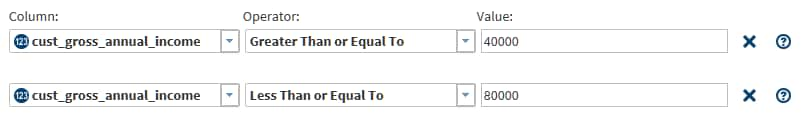
Click Filter Data to define rules that include only desired data in the target.
-
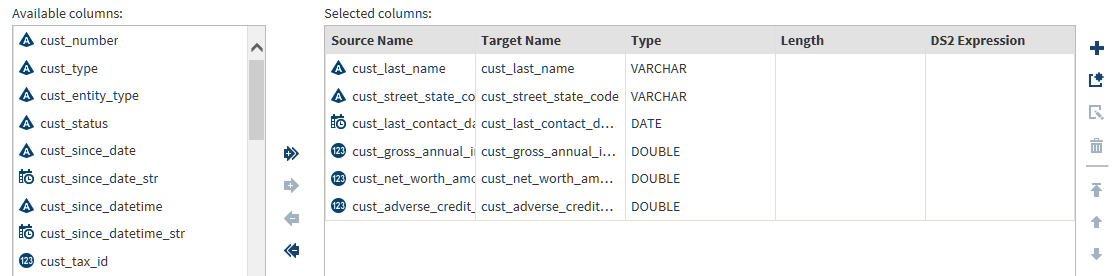
Click Manage Columns to manage the columns in your target table. You can select source columns, reorder columns, and rename columns. You can also add or repurpose target columns to store the results of DS2 expressions. An advanced editor is provided to assist with the development of DS2 expressions.Note: To apply HiveQL expressions rather than DS2 expressions, see the Manage Columns transformation in the Query or Join Data in Hadoop directive.
-
Click Summarize Columns to group rows based on the values in one or more columns. For each group, you can generate summary aggregations from selected numeric columns.
-
-
Select the columns that you will use to filter the rows that will be written into the target table. For example, in a table of customer information, you could limit the data in your target to customers with incomes between $40,000 and $80,000. This filter requires two rules, and both rules must be true in order for the source row to be written to the target.
-
The operators that are available depend on the type of the column. To learn about available operators, see About the Operators in the Filter Data Transformation.
-
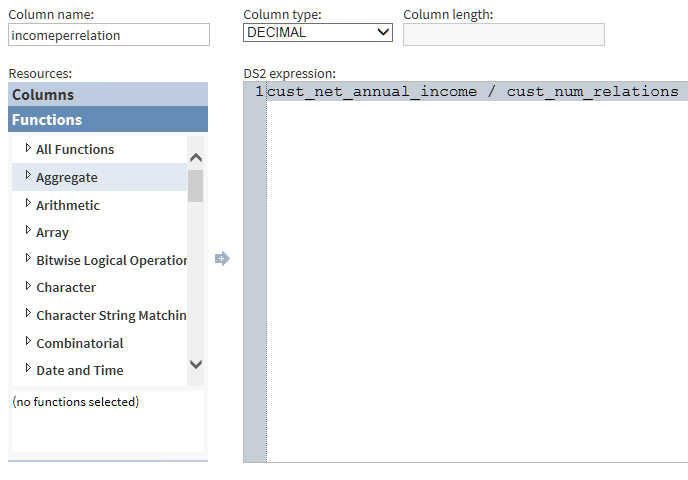
To use the Advanced Editor, enter a Column Name, and then apply DS2 functions to specified target columns. When you select a column, syntax help appears at the bottom of Resources. When your DS2 expression is complete, select Save or Save New to return to the Manage Columns transformation. The new column appears at the bottom of Selected Columns.
-
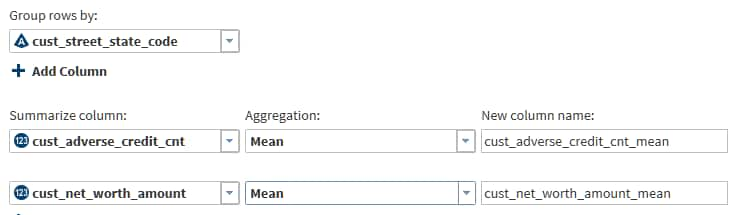
In the Summarize Rows task, click Group rows by to specify a column whose values will be used to group rows. You can specify additional columns that will form subgroups. Each group and subgroup will receive a value in each aggregation column.Note: If your source data is in Hive 13 format or lower, the Summarize Rows task will not handle special characters in column names. To resolve the issue, either rename the columns or move the source table into Hive 14 format.
-
Click Select a column to specify a summarization, and then click and select an aggregation. to learn about the available aggregations, see About the Aggregations in the Summarize Rows Transformation.
-
Click Next to display the Result task. In the Result page, click Save or Save As to store your job in your shared folder. If you want to run your job now, click Start transforming data. Otherwise, you can run your job later from Saved Directives.


About the Operators in the Filter Data Transformation
The following table
describes filter operators by the data type of the selected column.
|
Operator
|
Source ColumnData
Types
|
Description and Example
|
|---|---|---|
|
Equal To
|
The Equal To operator
is available for use with all source data types, which include the
following:
Character
 Numeric
 Datetime
 |
The source value is
accepted and its row is written to the target table only when the
source value exactly matches the comparator.
Character values can
be case-sensitive. Blank spaces are included in the comparison.
Datetime values in the
comparator use the SAS format DATETIME(w.p).
Gender Equal
                                 To Male
PrefCustomer
Equal To 1SaleDate
Equal To 5/1/2014 |
|
Not Equal To
|
|
Accepts the source row
when the column value is anything other than the comparator.
Region Not
                                 Equal To Europe
NumChildren
Not Equal To 0SaleDate
Not Equal To 11/25/2013 |
|
Null
|
|
Accepts the source row
when the column value is NULL or if no source value is present.
CreditScore
                                 Null
AnnualIncome
Null |
|
Not Null
|
|
Accepts the source row
when the column value is present and when the value is not NULL.
PostalCode
                                 Not Null
PhoneNumber
Not Null |
|
In
|
|
Accepts the source row
when the column value is included in its entirety within the comparator.
The comparator consists of a list of constant values. The list consists
of a vertical list of individual entries, without commas. Blank spaces
are interpreted literally. Case sensitivity can be enabled.
CarManuf
In BMW VWBenzWaistSize
In32343638 |
|
Not In
|
|
Accepts the source row
when the column value is not included anywhere within the comparator’s
list of constant values.
City Not
                                 In New York
Chicago Los
AngelesWaistSize
Not In 32 343638 |
|
Like
|
|
Accepts the source row
when the column value matches the result of an expression in the comparator.
The source value and the comparator are compared on a character-by-character
basis. For character columns, case sensitivity can be enabled.
Use the pattern-matching
character
% to indicate any string of characters.
Use the underscore character _ to indicate
any single character in that position.
Note that trailing blank
characters are written to the target table when using
% at
the end of the comparator.
Use the word
escape to
include literal instances of % and _ in
the comparator.
SalesRegion
                                 Like NorthAmer%
AnnualSales
Like 199_CustSatisfaction
Like 100 escape % |
|
Not Like
|
|
Accepts the source row
when the column value does not match the result of an expression in
the comparator. The source value and the comparator are compared on
a character-by-character basis. For character columns, case sensitivity
can be enabled. Pattern-matching characters
% and _ and escape are
valid as described for the Like operator.
Sports Not
                                 Like %ball
FootballFieldLength
Not Like 100% |
|
Contains
|
|
Accepts the source row
when the column value is found within the character string of the
comparator. Case sensitivity can be enabled.
Address
                                 Contains IL
LicenseNumber
Contains 7227 |
|
Not Contains
|
|
Accepts the source row
when the column value is not found within the character string of
the comparator. Case sensitivity can be enabled.
Month Not
                                 Contains OctNovDec
SalesMonthly
Not Contains 0 |
|
Between
|
|
Accepts the source row
when the column value or date is between the two values or dates in
the comparator, but is not equal to either.
GradeAverage
                                 Between 87.5 93
DailySales
Between December 20, 2014 December 27, 2014 |
|
Greater Than
|
|
Accepts the source row
when the column value is greater than the value of the comparator.
AnnualSales
GreaterThan 100000 |
|
Greater Than Or Equal
To
|
|
Accepts the source row
when the column value is equal to the comparator or greater than the
comparator.
CarsInFamily
Greater Than or Equal To 3 |
|
Less Than
|
|
Accepts the source row
when the column value is less than the value of the comparator.
GamerAge
Less Than 30 |
|
Less Than Or Equal To
|
|
Accepts the source row
when the column value is equal to the value of the comparator, or
less than the value of the comparator.
SalesYear
Less Than Or Equal To 2010 |
|
After
|
|
Accepts the source row
when the column date is later than the date in the comparator.
HomePurchaseDate
After January 1, 2013 |
|
Before
|
|
Accepts the source row
when the column date is earlier than the date in the comparator.
BirthDate
Before March 17, 1980 |
|
On Or After
|
|
Accepts the source row
when the column date is later than, or the same date as, the date
in the comparator.
DailySales
On Or After January 1, 2014 |
|
On Or Before
|
|
Accepts the source row
when the column date is earlier than, or the same date as, the date
in the comparator.
DailySales
On Or Before December 31, 2013 |
About the Aggregations in the Summarize Rows Transformation
The
aggregations that are available in the Summarize Rows transformation
are defined as follows:
Count
the number of rows
in the group that contain valid values.
Count Distinct
the number of unique
values in the column for each group.
Corrected Sum of Squares
measures variability
or dispersion around the mean. To learn more about this (and other)
statistical summaries, see the Introduction to Statistical
Modeling with SAS/STAT Software.
Covariance
measures the strength
of the correlation of the values in the group. A positive value indicates
that values move in the same direction within the group. A negative
value indicates that values move in opposite or random directions.
Max
the maximum value in
the column for each group.
Mean
the calculated center
value between the maximum and minimum values in the group.
Min
the minimum value in
the group.
Number of Missing Values
the number of rows
in the group that contain a blank or NULL value.
Range
the difference between
the lowest and highest values in the group.
Standard Deviation
measures the degree
of variance, or the degree in which the values in the group deviate
from the mean. A small value indicates little deviation. The standard
deviation is the square root of the Variance.
Standard Error
measures the applicability
or accuracy of the mean as it applies to the values in the group.
A small value indicates that the mean is a more accurate reflection
of the values in the group.
Sum
adds the values in
the group.
Variance
the average of the
squared differences from the mean, which measure diversity in the
group
Usage Notes
If necessary, you can
change the maximum length of character columns for input tables to
this directive. For more information,
see Change the Maximum Length for SAS Character Columns.
Copyright © SAS Institute Inc. All rights reserved.