Click on the About tab within each sample for product and release requirements.
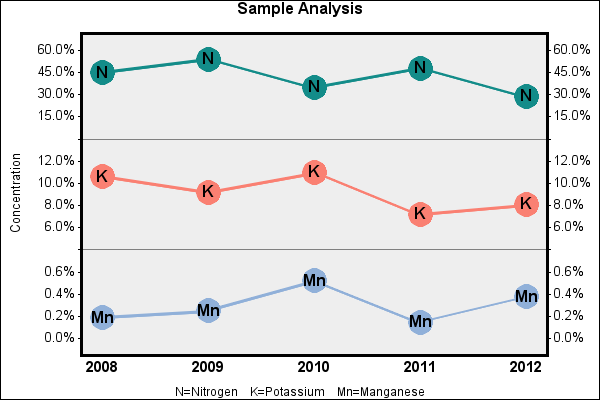
Sample 52648 - Display multiple axis scales and label plot points with PROC GPLOT[ View Code ]
Sample 50993 - Use hardware font symbols as plotting symbols with PROC GPLOT[ View Code ]
Sample 50209 - Use solid-filled symbols with PROC GPLOT[ View Code ]

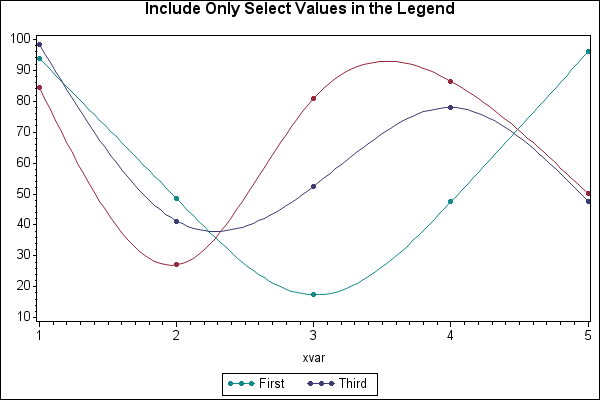
Sample 46723 - Include only select values in the legend with PROC GPLOT[ View Code ]
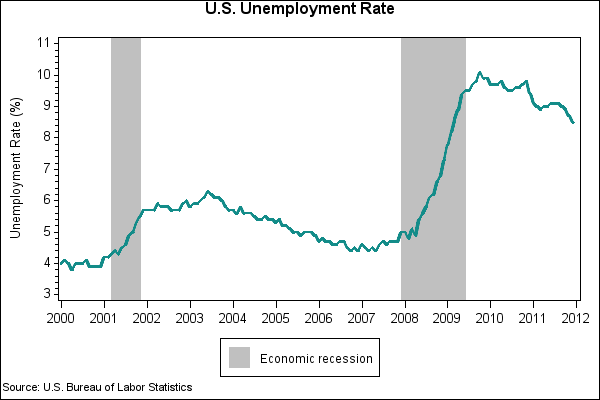
Sample 42893 - Shade the graph background for a data range[ View Code ]
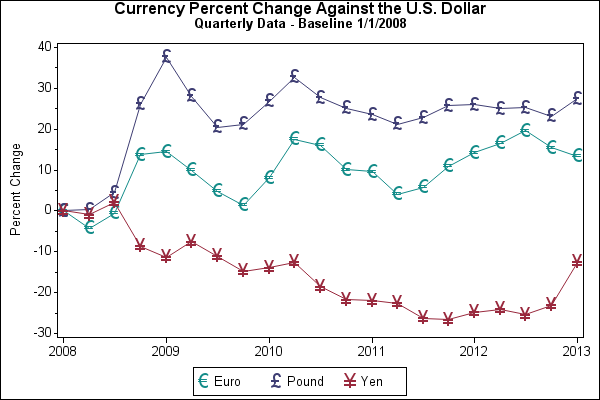
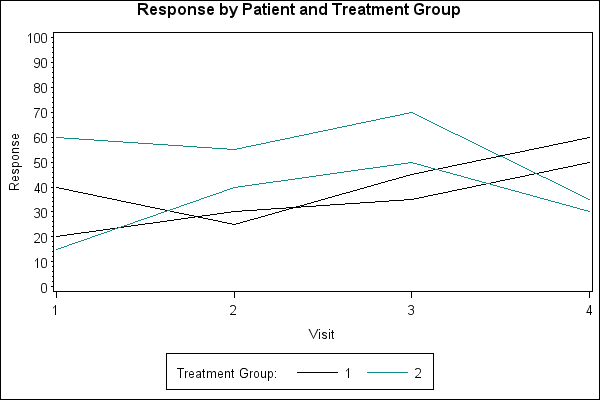
Sample 38076 - Create a spaghetti plot with the GPLOT procedure[ View Code ]
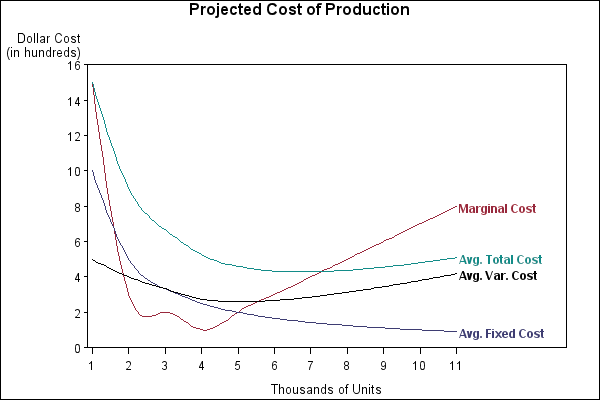
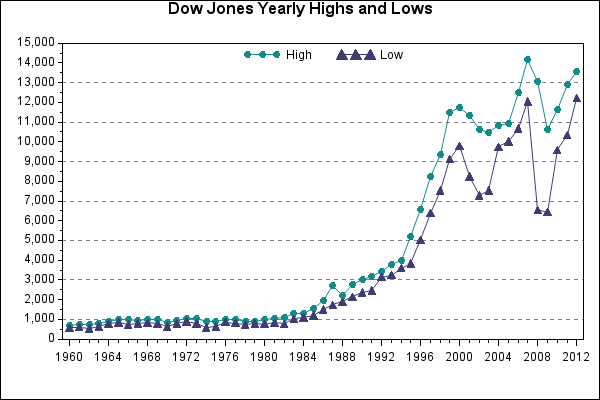
Sample 25581 - Generate an overlay plot using PROC GPLOT[ View Code ]
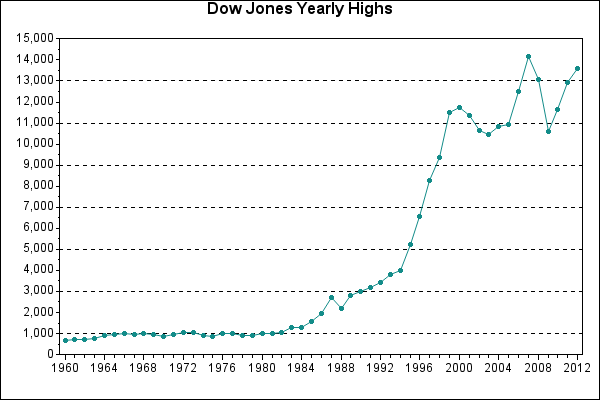
Sample 25579 - Connect plot data points using PROC GPLOT[ View Code ]
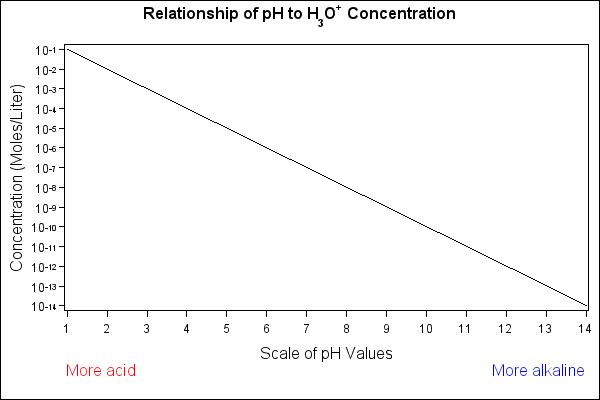
Sample 25505 - Specify logarithmic axes using PROC GPLOT[ View Code ]
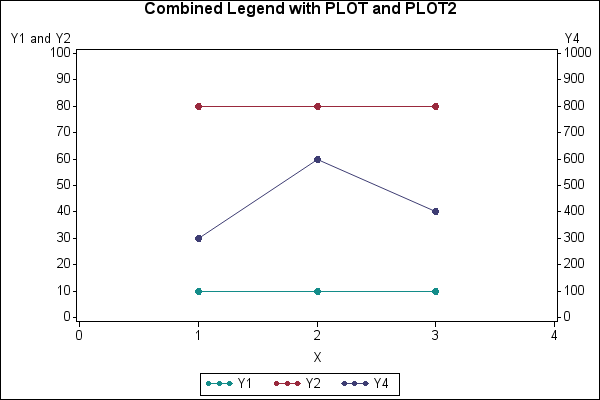
Sample 24932 - Display the left and right axes with a single combined legend with PROC GPLOT[ View Code ]
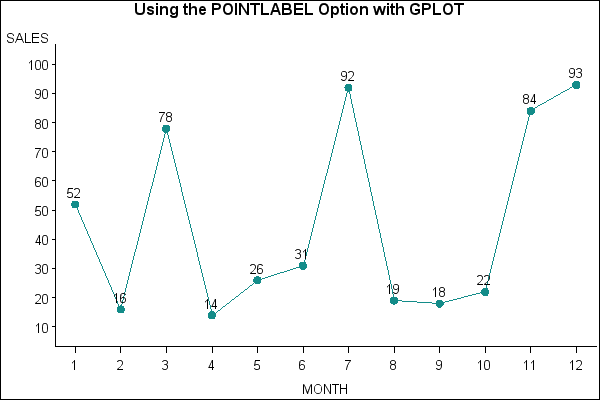
Sample 24930 - Label data points with PROC GPLOT and the POINTLABEL option[ View Code ]
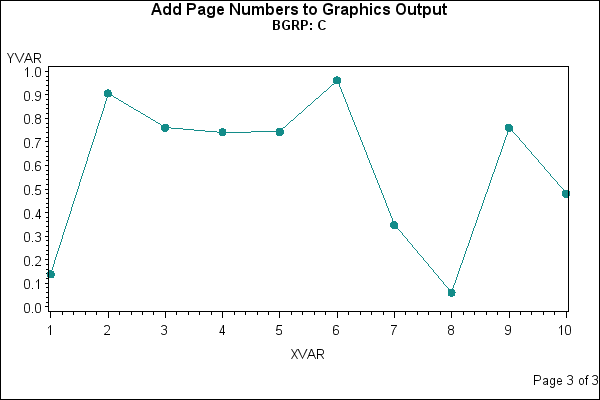
Sample 24929 - Generate page numbers on BY-group processed plots[ View Code ]
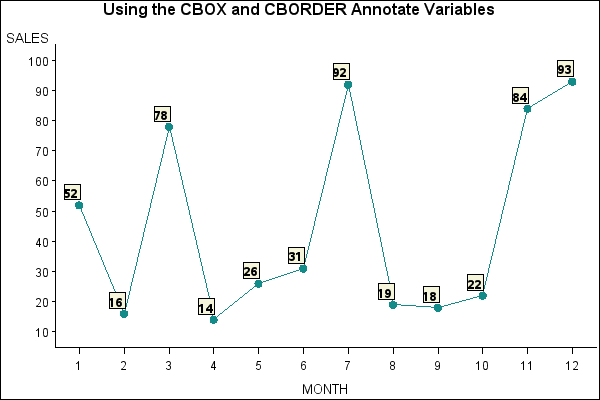
Sample 24915 - Label data points with the Annotate CBOX and CBORDER variables[ View Code ]
Sample 24837 - Label plot lines in an overlay plot using PROC GPLOT with Annotate[ View Code ]