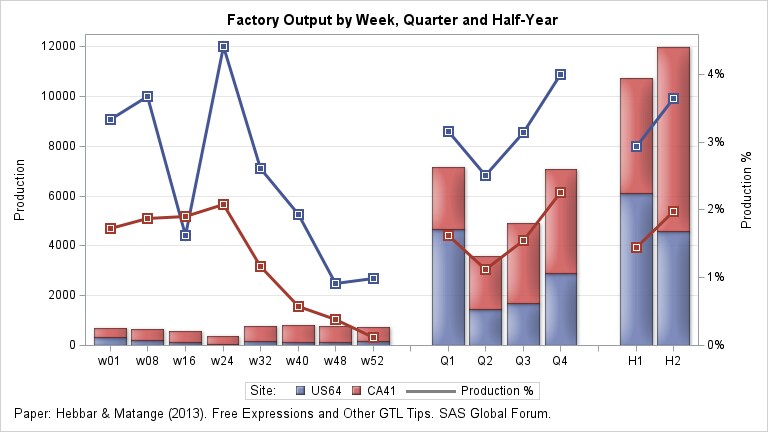
Sample 69816: Using the Graph Template Language, GTL, and PROC SGRENDER to create a bar chart with a line overlay
This SAS Note shows how to use the Graph Template Language, GTL, and the SGRENDER procedure to create a bar chart with a line overlay.
These sample files and code examples are provided by SAS Institute
Inc. "as is" without warranty of any kind, either express or implied, including
but not limited to the implied warranties of merchantability and fitness for a
particular purpose. Recipients acknowledge and agree that SAS Institute shall
not be liable for any damages whatsoever arising out of their use of this material.
In addition, SAS Institute will provide no support for the materials contained herein.
This sample code shows how to use the Graph Template Language, GTL, and PROC SGRENDER to create a bar chart with a line overlay.
data plantProd;
  attrib prod label='Production';
  attrib prod_pct label='Production %' format=percent5.2;
  input prod prod_pct Time $ Site $;
  Time=translate(Time, 'A0'x, '.');  /* map '.' to non-breaking space */
  datalines;
321 0.0334  w01 US64
373 0.0173  w01 CA41
218 0.0367  w08 US64
420 0.0188  w08 CA41
117 0.0163  w16 US64
461 0.0190  w16 CA41
64  0.0441  w24 US64
320 0.0208  w24 CA41
156 0.0261  w32 US64
620 0.0116  w32 CA41
115 0.0193  w40 US64
700 0.0058  w40 CA41
110 0.0091  w48 US64
642 0.0039  w48 CA41
157 0.0099  w52 US64
586 0.0012  w52 CA41
.   .       ..  US64
.   .       ..  CA41
4657  0.0315  Q1  US64
2491  0.0162  Q1  CA41
1434  0.0251  Q2  US64
2147  0.0112  Q2  CA41
1696  0.0314  Q3  US64
3206  0.0155  Q3  CA41
2895  0.0399  Q4  US64
4174  0.0226  Q4  CA41
.     .       ... US64
.     .       ... CA41
6091  0.0294  H1  US64
4638  0.0145  H1  CA41
4591  0.0364  H2  US64
7380  0.0197  H2  CA41
;
run;

proc template;
 define statgraph chunked;
  begingraph ;
    dynamic _icon _yaxis _xaxis;
    EntryTitle "Factory Output by Week, Quarter and Half-Year" ;

%let line_attr_opts = pattern=solid thickness=3;
%let marker_attr_opts = symbol=squareFilled size=12;

    legendItem name="line" type=line /
        lineattrs=(color=grey &line_attr_opts)
        label="Production %";
    layout overlay / xaxisopts=( display=_xaxis type=discrete )
        yaxisopts=( griddisplay=on offsetmin=0 display=_yaxis)
        y2axisopts=( offsetmin=0 display=_yaxis);
      BarChartParm X=time Y=prod / group=Site name="bar" dataskin=matte
        fillAttrs=(transparency=0.1);
      SeriesPlot X=time Y=prod_pct / group=Site display=all break=true
        yaxis=y2 markerattrs=(&marker_attr_opts)
        lineattrs=( &line_attr_opts) ;
      /* inlay markers */
      ScatterPlot X=time Y=prod_pct /  yaxis=y2
        markerattrs=(color=white symbol=square size=8);
      if (exists(_icon) ne 1)
         DiscreteLegend "bar" "line" / title="Site:";
      endif;
    endlayout;
    if (exists(_icon) ne 1)
      entryFootnote halign=left
        textAttrs=(style=normal) "Paper: Hebbar & Matange (2013)."
                                " Free Expressions and Other GTL Tips."
        textAttrs=( ) " SAS Global Forum." ;
    endif;
  endgraph;
 end;
run;

/*--Create Graph--*/
ods graphics / reset noscale width=8in height=4.5in imagename='Chunked_V94';
proc sgrender template=chunked data=plantProd;
  dynamic _xaxis='ticks tickvalues';
run;
These sample files and code examples are provided by SAS Institute
Inc. "as is" without warranty of any kind, either express or implied, including
but not limited to the implied warranties of merchantability and fitness for a
particular purpose. Recipients acknowledge and agree that SAS Institute shall
not be liable for any damages whatsoever arising out of their use of this material.
In addition, SAS Institute will provide no support for the materials contained herein.
| Date Modified: | 2023-01-24 08:42:25 |
| Date Created: | 2023-01-18 15:48:48 |
Operating System and Release Information
| SAS System | Base SAS | z/OS | 9.3 TS1M2 | |
| z/OS 64-bit | 9.3 TS1M2 | |
| Microsoft® Windows® for x64 | 9.3 TS1M2 | |
| Microsoft Windows 8 Enterprise 32-bit | 9.3 TS1M2 | |
| Microsoft Windows 8 Enterprise x64 | 9.3 TS1M2 | |
| Microsoft Windows 8 Pro 32-bit | 9.3 TS1M2 | |
| Microsoft Windows 8 Pro x64 | 9.3 TS1M2 | |
| Microsoft Windows 8.1 Enterprise 32-bit | 9.3 TS1M2 | |
| Microsoft Windows 8.1 Enterprise x64 | 9.3 TS1M2 | |
| Microsoft Windows 8.1 Pro 32-bit | 9.3 TS1M2 | |
| Microsoft Windows 8.1 Pro x64 | 9.3 TS1M2 | |
| Microsoft Windows Server 2003 Datacenter Edition | 9.3 TS1M2 | |
| Microsoft Windows Server 2003 Enterprise Edition | 9.3 TS1M2 | |
| Microsoft Windows Server 2003 Standard Edition | 9.3 TS1M2 | |
| Microsoft Windows Server 2003 for x64 | 9.3 TS1M2 | |
| Microsoft Windows Server 2008 | 9.3 TS1M2 | |
| Microsoft Windows Server 2008 R2 | 9.3 TS1M2 | |
| Microsoft Windows Server 2008 for x64 | 9.3 TS1M2 | |
| Microsoft Windows Server 2012 Datacenter | 9.3 TS1M2 | |
| Microsoft Windows Server 2012 R2 Datacenter | 9.3 TS1M2 | |
| Microsoft Windows Server 2012 R2 Std | 9.3 TS1M2 | |
| Microsoft Windows Server 2012 Std | 9.3 TS1M2 | |
| Microsoft Windows XP Professional | 9.3 TS1M2 | |
| Windows 7 Enterprise 32 bit | 9.3 TS1M2 | |
| Windows 7 Enterprise x64 | 9.3 TS1M2 | |
| Windows 7 Home Premium 32 bit | 9.3 TS1M2 | |
| Windows 7 Home Premium x64 | 9.3 TS1M2 | |
| Windows 7 Professional 32 bit | 9.3 TS1M2 | |
| Windows 7 Professional x64 | 9.3 TS1M2 | |
| Windows 7 Ultimate 32 bit | 9.3 TS1M2 | |
| Windows 7 Ultimate x64 | 9.3 TS1M2 | |
| Windows Vista | 9.3 TS1M2 | |
| Windows Vista for x64 | 9.3 TS1M2 | |
| 64-bit Enabled AIX | 9.3 TS1M2 | |
| 64-bit Enabled HP-UX | 9.3 TS1M2 | |
| 64-bit Enabled Solaris | 9.3 TS1M2 | |
| HP-UX IPF | 9.3 TS1M2 | |
| Linux | 9.3 TS1M2 | |
| Linux for x64 | 9.3 TS1M2 | |
| Solaris for x64 | 9.3 TS1M2 | |


