Sample 69815: Using the Graph Template Language, GTL, and PROC SGRENDER to produce a bar chart with a broken axis
This SAS Note shows how to use the Graph Template Language, GTL, and the SGRENDER procedure to produce a bar chart with a broken axis.
These sample files and code examples are provided by SAS Institute
Inc. "as is" without warranty of any kind, either express or implied, including
but not limited to the implied warranties of merchantability and fitness for a
particular purpose. Recipients acknowledge and agree that SAS Institute shall
not be liable for any damages whatsoever arising out of their use of this material.
In addition, SAS Institute will provide no support for the materials contained herein.
This sample code shows how to use the Graph Template Language, GTL, and PROC SGRENDER to produce a bar chart with a broken axis.
data TallBar;
input X $ Y;
length highcap $12;
high=y; low=0;
if y > 20 then do; high=20; highcap='FILLEDARROW'; end;
datalines;
A 10
B 15
C 12
D 17
E 215
F 220
;
run;
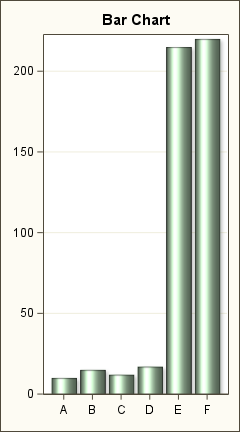
/*--Basic Bar Chart of all data--*/
proc template;
define statgraph Bar_Chart;
begingraph;
entrytitle 'Bar Chart';
layout overlay / xaxisopts=(display=(ticks tickvalues))
yaxisopts=(display=(ticks tickvalues) griddisplay=on);
barchart x=x y=y / dataskin=sheen;
endlayout;
endgraph;
end;
run;
ods graphics / reset noscale width=2.5in height=4.5in imagename='BrokenAxis_BarChart_V94';
proc sgrender data=TallBar template=Bar_Chart;
run;
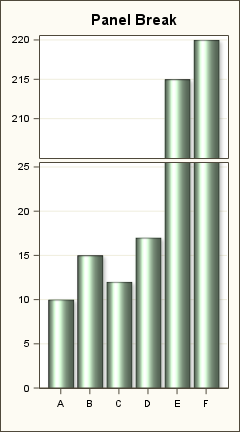
/*--Full Panel Break--*/
proc template;
define statgraph Panel_Break;
dynamic _icon;
begingraph;
entrytitle 'Panel Break';
layout lattice / rows=2 columndatarange=union rowdatarange=union
rowweights=(0.35 0.65) rowgutter=2;
columnaxes;
columnaxis / display=(ticks tickvalues) tickvalueattrs=(size=7);
endcolumnaxes;
if (exists(_icon))
rowaxes;
rowaxis / display=none offsetmin=0;
rowaxis / display=none offsetmin=0;
endrowaxes;
endif;
layout overlay / yaxisopts=(griddisplay=on display=(ticks tickvalues)
tickvalueattrs=(size=7)
offsetmin=0 linearopts=(viewmin=205
tickvaluelist=(210 215 220)));
barchart x=x y=y / dataskin=sheen;
endlayout;
layout overlay / yaxisopts=(griddisplay=on display=(ticks tickvalues)
tickvalueattrs=(size=7)
offsetmin=0 linearopts=(viewmax=25 tickvaluelist=(0 5 10 15 20 25)));
barchart x=x y=y / dataskin=sheen;
endlayout;
endlayout;
endgraph;
end;
run;
ods graphics / reset noscale width=2.5in height=4.5in imagename='BrokenAxis_PanelBreak_V94';
proc sgrender data=TallBar template=Panel_Break;
run;
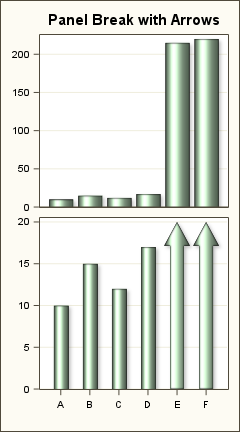
/*--Panel Break with Arrows--*/
proc template;
define statgraph High_Low;
begingraph;
dynamic _icon _title;
entrytitle _title;
layout lattice / rows=2 columndatarange=union rowdatarange=union
rowweights=(0.5 0.5) rowgutter=2;
columnaxes;
columnaxis / tickvalueattrs=(size=7) display=(ticks tickvalues);
endcolumnaxes;
if (exists(_icon))
rowaxes;
rowaxis / display=none offsetmin=0;
rowaxis / display=none offsetmin=0;
endrowaxes;
endif;
layout overlay / yaxisopts=(display=(ticks tickvalues) offsetmin=0
griddisplay=on tickvalueattrs=(size=7) );
barchart x=x y=y / barwidth=0.8 dataskin=sheen;
endlayout;
layout overlay / yaxisopts=(display=(ticks tickvalues) offsetmin=0
griddisplay=on tickvalueattrs=(size=7)) ;
highlowplot x=x low=low high=high / type=bar highcap=highcap barwidth=0.95 dataskin=sheen;
endlayout;
endlayout;
endgraph;
end;
run;
ods graphics / reset noscale width=2.5in height=4.5in imagename='BrokenAxis_HighLow_V94';
proc sgrender data=TallBar template=High_Low;
dynamic _title='Panel Break with Arrows';
run;
These sample files and code examples are provided by SAS Institute
Inc. "as is" without warranty of any kind, either express or implied, including
but not limited to the implied warranties of merchantability and fitness for a
particular purpose. Recipients acknowledge and agree that SAS Institute shall
not be liable for any damages whatsoever arising out of their use of this material.
In addition, SAS Institute will provide no support for the materials contained herein.
| Date Modified: | 2023-01-24 08:41:44 |
| Date Created: | 2023-01-18 15:40:42 |
Operating System and Release Information
| SAS System | Base SAS | z/OS | 9.4 TS1M0 | |
| z/OS 64-bit | 9.4 TS1M0 | |
| Microsoft® Windows® for x64 | 9.4 TS1M0 | |
| Microsoft Windows 8 Enterprise x64 | 9.4 TS1M0 | |
| Microsoft Windows 8 Pro x64 | 9.4 TS1M0 | |
| Microsoft Windows 8.1 Enterprise 32-bit | 9.4 TS1M0 | |
| Microsoft Windows 8.1 Enterprise x64 | 9.4 TS1M0 | |
| Microsoft Windows 8.1 Pro 32-bit | 9.4 TS1M0 | |
| Microsoft Windows 8.1 Pro x64 | 9.4 TS1M0 | |
| Microsoft Windows 10 | 9.4 TS1M0 | |
| Microsoft Windows Server 2008 R2 | 9.4 TS1M0 | |
| Microsoft Windows Server 2008 for x64 | 9.4 TS1M0 | |
| Microsoft Windows Server 2012 Datacenter | 9.4 TS1M0 | |
| Microsoft Windows Server 2012 R2 Datacenter | 9.4 TS1M0 | |
| Microsoft Windows Server 2012 R2 Std | 9.4 TS1M0 | |
| Microsoft Windows Server 2012 Std | 9.4 TS1M0 | |
| Windows 7 Enterprise x64 | 9.4 TS1M0 | |
| Windows 7 Professional x64 | 9.4 TS1M0 | |
| 64-bit Enabled AIX | 9.4 TS1M0 | |
| 64-bit Enabled Solaris | 9.4 TS1M0 | |
| HP-UX IPF | 9.4 TS1M0 | |
| Linux for x64 | 9.4 TS1M0 | |
| Solaris for x64 | 9.4 TS1M0 | |