Sample 66393: Use the Annotate facility to create a vertical axis label above a graph
This sample uses the Annotate facility to annotate the vertical axis label above a graph.
These sample files and code examples are provided by SAS Institute
Inc. "as is" without warranty of any kind, either express or implied, including
but not limited to the implied warranties of merchantability and fitness for a
particular purpose. Recipients acknowledge and agree that SAS Institute shall
not be liable for any damages whatsoever arising out of their use of this material.
In addition, SAS Institute will provide no support for the materials contained herein.
This sample uses the Annotate facility to annotate the vertical axis label above a graph.
/* Define an annotate data set to place a label above the Y axis */
data annolabel;
   xsys='3';
   ysys='1';
   x=0;
   y=100;
   function='label';
   text="Height of Student";
   position='3';
   size=1.2;
run;

title 'Annotate vertical axis label above the graph';
/* If your graph does not have a title, define a title with a blank space to add space for the annotation */

/* Suppress the response axis label */
axis1 label=none;
proc gchart data=sashelp.class;
   vbar name / sumvar=height raxis=axis1 anno=annolabel;
run;
quit;
These sample files and code examples are provided by SAS Institute
Inc. "as is" without warranty of any kind, either express or implied, including
but not limited to the implied warranties of merchantability and fitness for a
particular purpose. Recipients acknowledge and agree that SAS Institute shall
not be liable for any damages whatsoever arising out of their use of this material.
In addition, SAS Institute will provide no support for the materials contained herein.
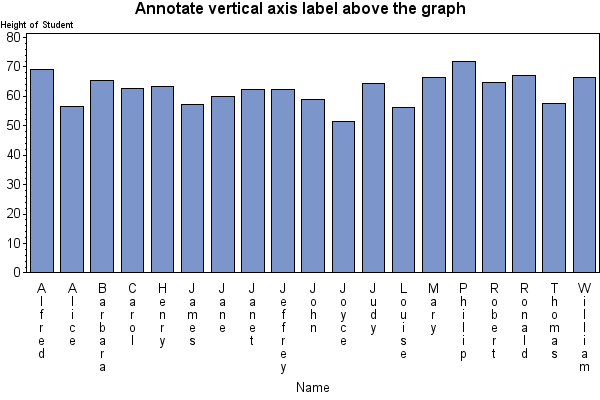
This SAS Note demonstrates how to use the Annotate facility to place a label above the vertical axis.
| Type: | Sample |
| Topic: | SAS Reference ==> Procedures ==> GCHART
|
| Date Modified: | 2020-08-11 09:05:25 |
| Date Created: | 2020-07-29 13:25:03 |
Operating System and Release Information
| SAS System | SAS/GRAPH | z/OS | 9.3 | | 9.3 TS1M0 | |
| Microsoft® Windows® for x64 | 9.3 | | 9.3 TS1M0 | |
| Microsoft Windows Server 2003 Datacenter Edition | 9.3 | | 9.3 TS1M0 | |
| Microsoft Windows Server 2003 Enterprise Edition | 9.3 | | 9.3 TS1M0 | |
| Microsoft Windows Server 2003 Standard Edition | 9.3 | | 9.3 TS1M0 | |
| Microsoft Windows Server 2003 for x64 | 9.3 | | 9.3 TS1M0 | |
| Microsoft Windows Server 2008 | 9.3 | | 9.3 TS1M0 | |
| Microsoft Windows Server 2008 R2 | 9.3 | | 9.3 TS1M0 | |
| Microsoft Windows Server 2008 for x64 | 9.3 | | 9.3 TS1M0 | |
| Microsoft Windows XP Professional | 9.3 | | 9.3 TS1M0 | |
| Windows 7 Enterprise 32 bit | 9.3 | | 9.3 TS1M0 | |
| Windows 7 Enterprise x64 | 9.3 | | 9.3 TS1M0 | |
| Windows 7 Home Premium 32 bit | 9.3 | | 9.3 TS1M0 | |
| Windows 7 Home Premium x64 | 9.3 | | 9.3 TS1M0 | |
| Windows 7 Professional 32 bit | 9.3 | | 9.3 TS1M0 | |
| Windows 7 Professional x64 | 9.3 | | 9.3 TS1M0 | |
| Windows 7 Ultimate 32 bit | 9.3 | | 9.3 TS1M0 | |
| Windows 7 Ultimate x64 | 9.3 | | 9.3 TS1M0 | |
| Windows Vista | 9.3 | | 9.3 TS1M0 | |
| Windows Vista for x64 | 9.3 | | 9.3 TS1M0 | |
| 64-bit Enabled AIX | 9.3 | | 9.3 TS1M0 | |
| 64-bit Enabled HP-UX | 9.3 | | 9.3 TS1M0 | |
| 64-bit Enabled Solaris | 9.3 | | 9.3 TS1M0 | |
| HP-UX IPF | 9.3 | | 9.3 TS1M0 | |
| Linux | 9.3 | | 9.3 TS1M0 | |
| Linux for x64 | 9.3 | | 9.3 TS1M0 | |
| Solaris for x64 | 9.3 | | 9.3 TS1M0 | |


