Sample 61187: Defining a color gradient for bars on a bar chart in SAS® Visual Analytics
 |  |  |
Overview
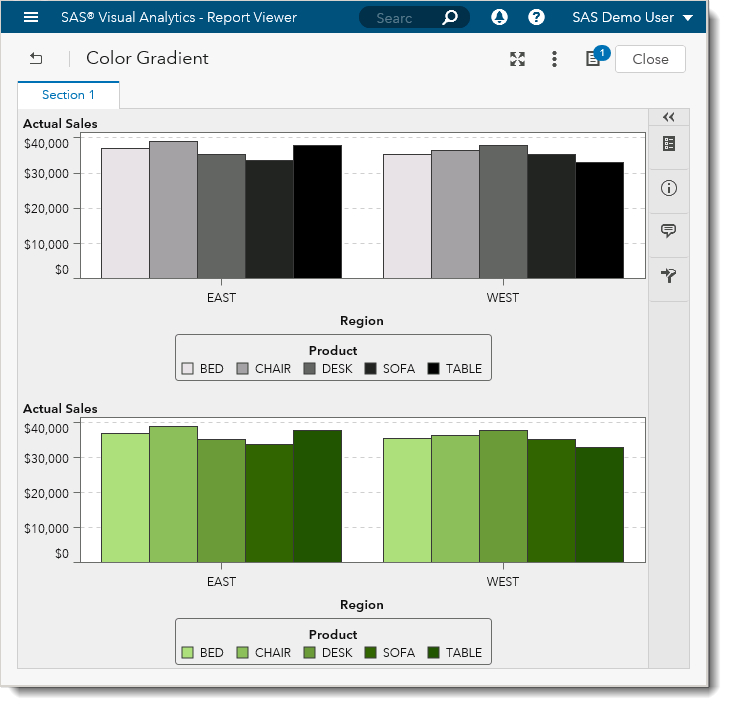
In some cases, you need to create graphs that display color gradients, or color progressions, of one base color instead of various different colors. This example explains two ways to specify color gradients on a SAS Visual Analytics bar chart. These same techniques can be used to specify a custom graph color sequence of different colors as well.
Below is an example of a SAS Visual Analytics report with custom bar color specifications in a color gradient.

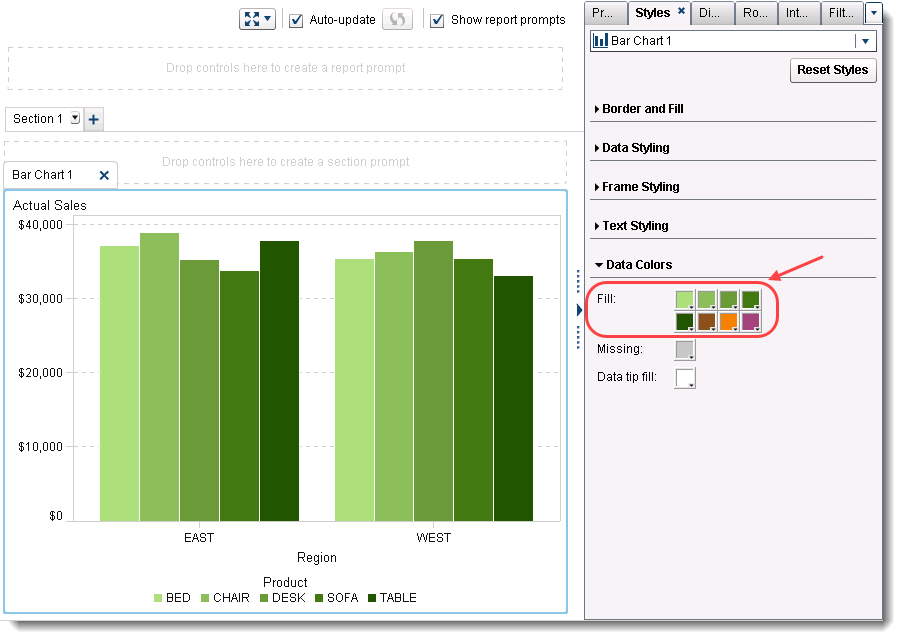
Technique 1: Specify Data Colors for Bars on an Individual Report Object
You can specify data colors on the Styles tab for each bar chart, as shown in the following display. SAS Visual Analytics does not offer patterns instead of colors for bar chart data styles. The fill coloring must be specified on each bar chart that is added to a report.

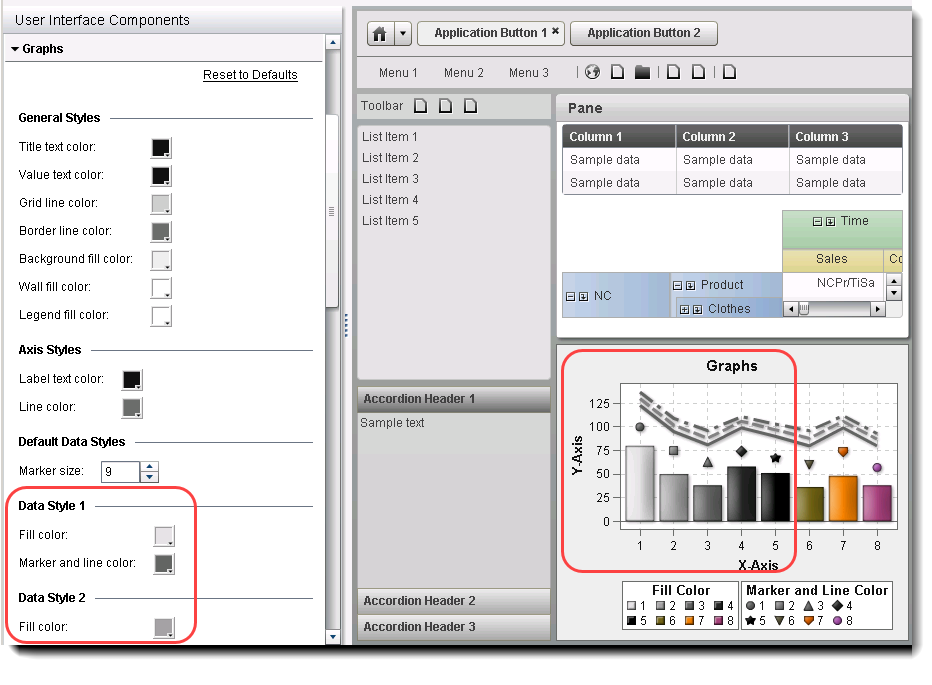
Technique 2: Specify Data Colors for Bars in a Custom Theme
If none of the standard themes provide the preferred bar coloring, you can specify data styles in a custom theme. This custom theme can be applied at the report level so that only some reports are affected. It can also be applied at the application level so that the theme is applied to every report. You select a report theme on the Styles tab at the report level. The following display is from the SAS® Theme Designer for Flex. For more information about themes, see the "About Report Themes" section in the SAS Visual Analytics: User's Guide.

These sample files and code examples are provided by SAS Institute Inc. "as is" without warranty of any kind, either express or implied, including but not limited to the implied warranties of merchantability and fitness for a particular purpose. Recipients acknowledge and agree that SAS Institute shall not be liable for any damages whatsoever arising out of their use of this material. In addition, SAS Institute will provide no support for the materials contained herein.
These sample files and code examples are provided by SAS Institute Inc. "as is" without warranty of any kind, either express or implied, including but not limited to the implied warranties of merchantability and fitness for a particular purpose. Recipients acknowledge and agree that SAS Institute shall not be liable for any damages whatsoever arising out of their use of this material. In addition, SAS Institute will provide no support for the materials contained herein.
| Type: | Sample |
| Date Modified: | 2017-11-08 15:21:30 |
| Date Created: | 2017-10-03 21:53:15 |
Operating System and Release Information
| Product Family | Product | Host | Product Release | SAS Release | ||
| Starting | Ending | Starting | Ending | |||
| SAS System | SAS Visual Analytics | Microsoft® Windows® for x64 | 7.4 | 9.4 TS1M4 | ||
| Linux for x64 | 7.4 | 9.4 TS1M4 | ||||