Sample 49695: Bar chart with error bars displayed in the same cell
In order to include error bars on a bar chart, you need to use the Graph Template Language (GTL). With GTL, you can add error bars on a bar chart when using the GROUP= option with the YERRORLOWER= and YERRORUPPER= options in the SCATTERPLOT statement.
The sample code on the Full Code tab illustrates this.
These sample files and code examples are provided by SAS Institute
Inc. "as is" without warranty of any kind, either express or implied, including
but not limited to the implied warranties of merchantability and fitness for a
particular purpose. Recipients acknowledge and agree that SAS Institute shall
not be liable for any damages whatsoever arising out of their use of this material.
In addition, SAS Institute will provide no support for the materials contained herein.
In order to include error bars on a bar chart, you need to use the Graph Template Language (GTL). With GTL, you can add error bars on a bar chart when using the GROUP= option with the YERRORLOWER= and YERRORUPPER= options in the SCATTERPLOT statement.
proc sort data=sashelp.class out=class;
   by sex;
run;

proc means data=class nway mean clm noprint;
   by sex;
   class age;
   var height;
   output out=new mean= lclm= uclm= / autoname;
run;

proc template;
   define statgraph barchart;
   begingraph;
      entrytitle 'Bar Chart with Error Bars';
      layout gridded / border=false;
         layout datalattice columnvar=sex / headerlabeldisplay=value cellwidthmin=50
                            columnheaders=bottom border=false columndatarange=union
                            columnaxisopts=(display=(line tickvalues))
                            rowaxisopts=(offsetmin=0 label='Mean Height' griddisplay=on);
            layout prototype / walldisplay=(fill);
               barchart x=age y=height_mean / group=sex barlabel=true
                                              name='bar' outlineattrs=(color=black);
               scatterplot x=age y=height_mean / group=sex yerrorlower=height_lclm
                                                 yerrorupper=height_uclm
                                                 markerattrs=(size=0) name='scatter'
                                                 errorbarattrs=(thickness=2) datatransparency=0.6;
	    endlayout;
         endlayout;
      endlayout;
   endgraph;
   end;
run;

proc sgrender data=new template=barchart;
run;
These sample files and code examples are provided by SAS Institute
Inc. "as is" without warranty of any kind, either express or implied, including
but not limited to the implied warranties of merchantability and fitness for a
particular purpose. Recipients acknowledge and agree that SAS Institute shall
not be liable for any damages whatsoever arising out of their use of this material.
In addition, SAS Institute will provide no support for the materials contained herein.
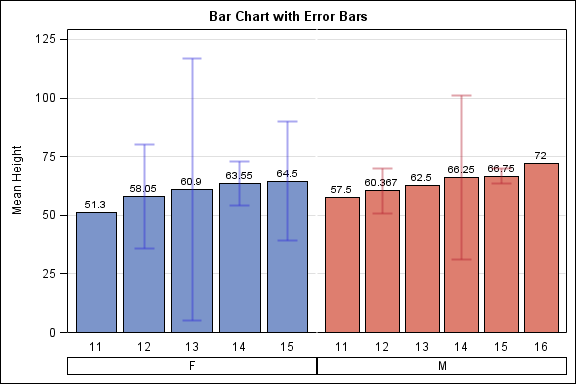
This sample illustrates how to generate a bar chart with error bars displayed in the same cell.
| Type: | Sample |
| Topic: | SAS Reference ==> Procedures ==> SGRENDER
|
| Date Modified: | 2013-04-30 15:25:02 |
| Date Created: | 2013-04-19 10:45:26 |
Operating System and Release Information
| SAS System | Base SAS | z/OS | 9.3 TS1M0 | |
| Z64 | 9.3 TS1M0 | |
| Microsoft® Windows® for x64 | 9.3 TS1M0 | |
| Microsoft Windows Server 2003 Datacenter Edition | 9.3 TS1M0 | |
| Microsoft Windows Server 2003 Enterprise Edition | 9.3 TS1M0 | |
| Microsoft Windows Server 2003 Standard Edition | 9.3 TS1M0 | |
| Microsoft Windows Server 2003 for x64 | 9.3 TS1M0 | |
| Microsoft Windows Server 2008 | 9.3 TS1M0 | |
| Microsoft Windows Server 2008 for x64 | 9.3 TS1M0 | |
| Microsoft Windows XP Professional | 9.3 TS1M0 | |
| Windows 7 Enterprise 32 bit | 9.3 TS1M0 | |
| Windows 7 Enterprise x64 | 9.3 TS1M0 | |
| Windows 7 Home Premium 32 bit | 9.3 TS1M0 | |
| Windows 7 Home Premium x64 | 9.3 TS1M0 | |
| Windows 7 Professional 32 bit | 9.3 TS1M0 | |
| Windows 7 Professional x64 | 9.3 TS1M0 | |
| Windows 7 Ultimate 32 bit | 9.3 TS1M0 | |
| Windows 7 Ultimate x64 | 9.3 TS1M0 | |
| Windows Vista | 9.3 TS1M0 | |
| Windows Vista for x64 | 9.3 TS1M0 | |
| 64-bit Enabled AIX | 9.3 TS1M0 | |
| 64-bit Enabled HP-UX | 9.3 TS1M0 | |
| 64-bit Enabled Solaris | 9.3 TS1M0 | |
| HP-UX IPF | 9.3 TS1M0 | |
| Linux | 9.3 TS1M0 | |
| Linux for x64 | 9.3 TS1M0 | |
| Solaris for x64 | 9.3 TS1M0 | |


