Sample 42893: Shade the graph background for a data range
 |  |  |  |  |
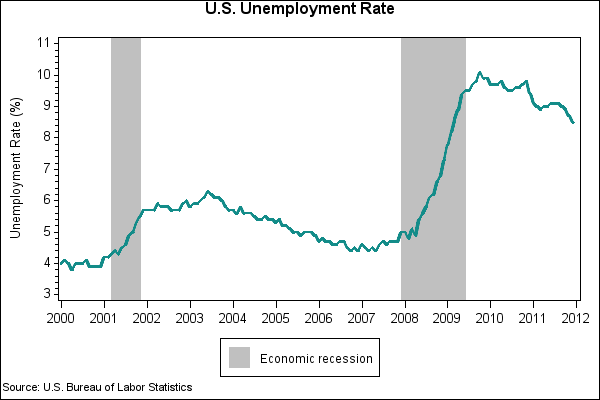
This sample illustrates how to use an Annotate data set to shade background areas on the graph for a given data range on the X axis. In this sample, areas are shaded between specified date ranges to highlight periods of economic recession.
These sample files and code examples are provided by SAS Institute Inc. "as is" without warranty of any kind, either express or implied, including but not limited to the implied warranties of merchantability and fitness for a particular purpose. Recipients acknowledge and agree that SAS Institute shall not be liable for any damages whatsoever arising out of their use of this material. In addition, SAS Institute will provide no support for the materials contained herein.
This sample illustrates how to use an Annotate data set to shade background areas on the graph for a given data range on the X axis. In this sample, areas are shaded between specified date ranges to highlight periods of economic recession.
The graphics output on the Results tab was produced using SAS® 9.2. Submitting the sample code with releases of SAS prior to SAS 9.2 might produce different results.
/* Set the graphics environment */
goptions reset=all border cback=white htitle=12pt htext=10pt;

/* Monthly unemployment rate data */
data one;
   input Year Jan Feb Mar Apr May Jun Jul Aug Sep Oct Nov Dec;
   datalines;
2000  4.0  4.1  4.0  3.8  4.0  4.0  4.0  4.1  3.9  3.9  3.9  3.9
2001  4.2  4.2  4.3  4.4  4.3  4.5  4.6  4.9  5.0  5.3  5.5  5.7
2002  5.7  5.7  5.7  5.9  5.8  5.8  5.8  5.7  5.7  5.7  5.9  6.0
2003  5.8  5.9  5.9  6.0  6.1  6.3  6.2  6.1  6.1  6.0  5.8  5.7
2004  5.7  5.6  5.8  5.6  5.6  5.6  5.5  5.4  5.4  5.5  5.4  5.4
2005  5.3  5.4  5.2  5.2  5.1  5.0  5.0  4.9  5.0  5.0  5.0  4.9
2006  4.7  4.8  4.7  4.7  4.6  4.6  4.7  4.7  4.5  4.4  4.5  4.4
2007  4.6  4.5  4.4  4.5  4.4  4.6  4.7  4.6  4.7  4.7  4.7  5.0
2008  5.0  4.8  5.1  4.9  5.4  5.6  5.8  6.1  6.2  6.6  6.8  7.3
2009  7.8  8.2  8.6  8.9  9.4  9.5  9.5  9.7  9.8  10.1 9.9  9.9
2010  9.7  9.7  9.7  9.8  9.6  9.5  9.5  9.6  9.6  9.7  9.8  9.4
2011  9.1  9.0  8.9  9.0  9.0  9.1  9.1  9.1  9.0  8.9  8.7  8.5
;
run;

/* Transpose the data to create one */
/* observation per month and year.  */
proc transpose data=one out=two;
   by year;
run;

/* Create a SAS date variable from */
/* the character month and year.   */
data unemployment(keep=datevar rate);
   set two(rename=(col1=rate));
   datevar=input(cats('01',_name_,year),date9.);
   format datevar date7.;
run;

/* Define the starting and ending dates  */
/* of recent economic recession periods. */
data recessions;
   input startdate :date7. enddate :date7.;
   format startdate enddate date7.;
   datalines;
01Mar01  01Nov01
01Dec07  01Jun09
;
run;

/* Create an Annotate data set to shade the background */
/* of the graph to highlight the recession periods.    */
data annorec;
   length function style color $8;
   retain xsys '2' ysys '1' when 'b';
   set recessions;

   function='move';
   x=startdate;
   y=0;
   output;

   function='bar';
   x=enddate;
   y=100;
   color='ltgray';
   style='solid';
   output;
run;

/* Define a title for the graph */
title1 "U.S. Unemployment Rate";

/* Define the footnotes for the graph. */
/* FOOTNOTE1 simulates a legend for the recession periods. */
footnote1 box=1 bspace=0.5 color=ltgray font=marker height=2 'U '
          color=black font='Albany AMT' height=9pt
          move=(+0,+0.5) "Economic recession";

footnote2 height=8pt justify=l ls=0.5 " Source: U.S. Bureau of Labor Statistics";

/* Define axis characteristics */
axis1 order=('01jan00'd to '01jan12'd by year)
      label=none;
axis2 label=(angle=90 "Unemployment Rate (%)");

/* Define symbol characteristics */
symbol1 interpol=join color=vibg width=2;

proc gplot data=unemployment;
   plot rate*datevar / haxis=axis1 vaxis=axis2 annotate=annorec;
   format datevar year4.;
run;
quit;
These sample files and code examples are provided by SAS Institute Inc. "as is" without warranty of any kind, either express or implied, including but not limited to the implied warranties of merchantability and fitness for a particular purpose. Recipients acknowledge and agree that SAS Institute shall not be liable for any damages whatsoever arising out of their use of this material. In addition, SAS Institute will provide no support for the materials contained herein.
This sample illustrates how to use an Annotate data set to shade background areas on the graph for a given data range on the X axis.
| Type: | Sample |
| Topic: | SAS Reference ==> Procedures ==> GPLOT Query and Reporting ==> Creating Reports ==> Graphical ==> Graph Elements ==> Annotation Query and Reporting ==> Creating Reports ==> Graphical ==> Graph Types ==> Plots ==> Line |
| Date Modified: | 2011-04-11 10:26:02 |
| Date Created: | 2011-04-08 11:18:35 |
Operating System and Release Information
| Product Family | Product | Host | SAS Release | |
| Starting | Ending | |||
| SAS System | SAS/GRAPH | z/OS | 9.2 TS1M0 | |
| Microsoft® Windows® for 64-Bit Itanium-based Systems | 9.2 TS1M0 | |||
| Microsoft Windows Server 2003 Datacenter 64-bit Edition | 9.2 TS1M0 | |||
| Microsoft Windows Server 2003 Enterprise 64-bit Edition | 9.2 TS1M0 | |||
| Microsoft Windows XP 64-bit Edition | 9.2 TS1M0 | |||
| Microsoft® Windows® for x64 | 9.2 TS1M0 | |||
| Microsoft Windows Server 2003 Datacenter Edition | 9.2 TS1M0 | |||
| Microsoft Windows Server 2003 Enterprise Edition | 9.2 TS1M0 | |||
| Microsoft Windows Server 2003 Standard Edition | 9.2 TS1M0 | |||
| Microsoft Windows XP Professional | 9.2 TS1M0 | |||
| Windows Vista | 9.2 TS1M0 | |||
| Windows Vista for x64 | 9.2 TS1M0 | |||
| 64-bit Enabled AIX | 9.2 TS1M0 | |||
| 64-bit Enabled HP-UX | 9.2 TS1M0 | |||
| 64-bit Enabled Solaris | 9.2 TS1M0 | |||
| HP-UX IPF | 9.2 TS1M0 | |||
| Linux | 9.2 TS1M0 | |||
| Linux for x64 | 9.2 TS1M0 | |||
| OpenVMS on HP Integrity | 9.2 TS1M0 | |||
| Solaris for x64 | 9.2 TS1M0 | |||