Usage Note 42069: Understanding the custom color palette feature in SAS® Web Report Studio
 |  |  |
Overview
Beginning with version 4.2, SAS Web Report Studio enables you to define a custom color palette for graphs. The colors that you select in the palette are assigned, in order, based on the graph’s requirements. For example, depending on data item assignments, a graph might use only one color, or it might use six different colors.
To illustrate how this feature works, this SAS note shows how the custom palette is used in a bar chart, a line graph, and a pie chart. For the example, the first four colors in the custom palette have been changed from the colors used in the currently selected style (Plateau) to the colors shown in the following display.

Note: These examples were created using version 4.3. The Graph skin option shown in the previous display is not available in version 4.2.
Note: A custom palette is not used for progressive bar charts, which use preset colors. Also, for bubble plots, the color saturation is lighter than the other graph types.
Custom colors applied to a bar chart
If you insert a bar chart with Total Inventory assigned to Bar Height and Region assigned to Bars, only the first custom color is used because that is the only color that is needed to graphically represent the information.

At this point, if you assign Product to Bar Subgroup, then SAS Web Report Studio must use all of the first four colors in the custom palette in order to identify the four products that are associated with each region.

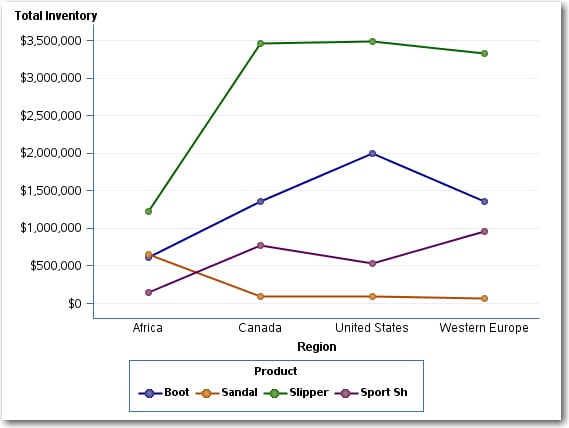
Custom colors applied to a line graph
Continuing with this example, the following display shows how the custom colors are used in a line graph when Total Inventory is assigned to Line Height, Region is assigned to Lines, and Product is assigned to Multiple Lines.
Custom colors applied to a pie chart
Finally, the following display shows how the custom colors are used in a pie chart when Total Inventory is assigned to Segment Size, Region is assigned to Segment, and Product is assigned to Pie Subgroup.

Operating System and Release Information
| Product Family | Product | System | Product Release | SAS Release | ||
| Reported | Fixed* | Reported | Fixed* | |||
| SAS System | SAS Web Report Studio | z/OS | 4.2 | 9.2 TS2M0 | ||
| Microsoft® Windows® for x64 | 4.2 | 9.2 TS2M0 | ||||
| Microsoft Windows Server 2003 Datacenter Edition | 4.2 | 9.2 TS2M0 | ||||
| Microsoft Windows Server 2003 Enterprise Edition | 4.2 | 9.2 TS2M0 | ||||
| Microsoft Windows Server 2003 Standard Edition | 4.2 | 9.2 TS2M0 | ||||
| Microsoft Windows Server 2003 for x64 | 4.2 | 9.2 TS2M0 | ||||
| Microsoft Windows Server 2008 for x64 | 4.2 | 9.2 TS2M0 | ||||
| Microsoft Windows XP Professional | 4.2 | 9.2 TS2M0 | ||||
| Windows Vista | 4.2 | 9.2 TS2M0 | ||||
| Windows Vista for x64 | 4.2 | 9.2 TS2M0 | ||||
| 64-bit Enabled AIX | 4.2 | 9.2 TS2M0 | ||||
| 64-bit Enabled Solaris | 4.2 | 9.2 TS2M0 | ||||
| HP-UX IPF | 4.2 | 9.2 TS2M0 | ||||
| Linux for x64 | 4.2 | 9.2 TS2M0 | ||||
| Solaris for x64 | 4.2 | 9.2 TS2M0 | ||||
| Type: | Usage Note |
| Priority: |
| Date Modified: | 2011-01-11 14:45:14 |
| Date Created: | 2011-01-11 12:14:25 |