Select Your Region
Americas
Europe
Middle East & Africa
Asia Pacific
Sample 35471: How to Create Your First Information Map in SAS® Information Map Studio 4.2
 |  |  |
Overview
SAS® Information Maps enable business analysts and information architects to organize data in ways that are meaningful to business users, while shielding the end users from the complexities of underlying data structures. This sample shows you how to create a new information map in SAS Information Map Studio 4.2. This sample is appropriate for both new information map creators and for existing users who want to familiarize themselves with the latest version.
Note: For more information about the new features, see What's New in SAS Information Map Studio 4.2.
About the Sample Tables
The two tables used in the sample are INVOICE and PRODUCT, which are both shipped with SAS. On Windows systems, these tables are located by default in C:\Program Files\SAS\SASFoundation\9.2\core\sample. On UNIX systems, the default location is /usr/local/SAS/samples.
In order for you to follow along, these tables must be registered in metadata and you must be authorized to access them.
Select the Tables for the Information Map
After you start up SAS Information Map Studio, your first task is to select the tables that contain the data that you want to analyze in your reports. After you select the tables, they become the data sources for your information map.
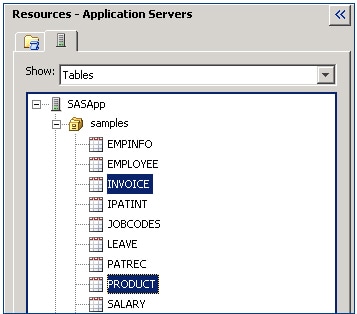
- The Resources ► Application Servers tab in the Resources pane should open by default. If it does not, then click the tab in order to display it.
- From the Show drop-down list, select Tables.
- Navigate to the location of the INVOICE and PRODUCT tables and then select them.
- Double-click the INVOICE and PRODUCT tables, or drag them to the Selected Resources pane on the Design tab. Expand the data sources so that their contents are visible. The Design tab should now look like this:
| About tables and data sources
The tables that you see listed on the Resources pane are metadata references to the underlying tables. The metadata consists of information about the tables such as column names and data types. Tables are accessed through a SAS Application Server. In this sample, the SAS Application Server is named SASApp. The tables that you select become data sources for the information map. Data sources do not store any actual data. |
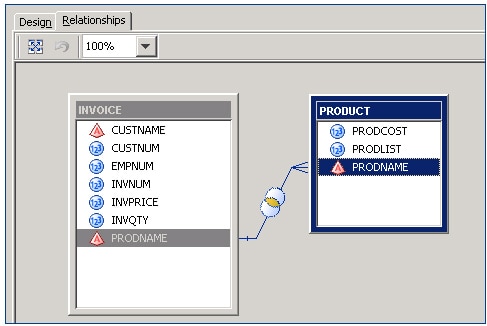
Define a Relationship between the Data Sources
Since you are using more than one data source, you must define a relationship between them so that they can be used together in your query. On the Relationships tab, click the PRODNAME column in the INVOICE data source and drag the mouse pointer to the PRODNAME column in the PRODUCT data source. A line is drawn between the two columns to show the relationship that you created. Click the Design tab when you are done.
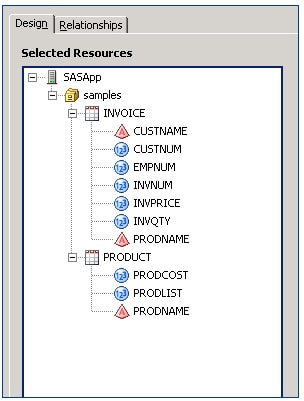
Add Data Items to the Information Map
Data source columns that you select to use in the information map are called "data items." To select data items, display the Design tab in the Selected Resources pane, and then double-click or use the arrow key to add the following data items to the Information Map Contents pane:
- From the INVOICE data source, select CUSTNAME, INVNUM, INVPRICE, and PRODNAME.
- From the PRODUCT data source, select PRODCOST and PRODLIST.
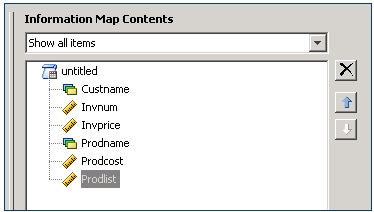
Here is what the Information Map Contents pane looks like after you select the data items.
Change the Data Item Names
One of the advantages of using information maps is that they hide obscure and complex data structures from the report creators and viewers. In this sample, you will give the data items more user-friendly names.
In the Information Map Contents pane, select Custname and notice that properties for this data item are displayed in the Properties pane to the right.
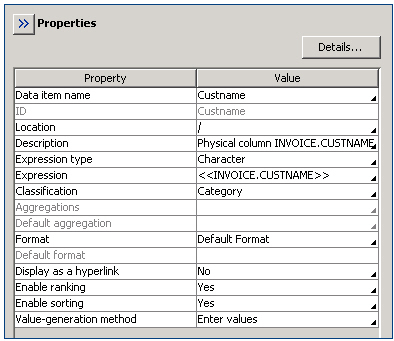
One way to change the name of a selected data item is to enter a new name in the Value field for the Data item name property. When you click in Value field, the entire property row is highlighted. To replace the existing name, just begin typing.
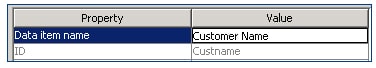
Rename the data items as shown in the following table.
| Original Value | New Value |
|---|---|
| Custname | Customer Name |
| Invnum | Invoice Number |
| Invprice | Invoice Amount |
| Prodname | Product |
| Prodcost | Cost |
| Prodlist | Retail Price |
Change the Value-Generation Method for Customer Name and Product
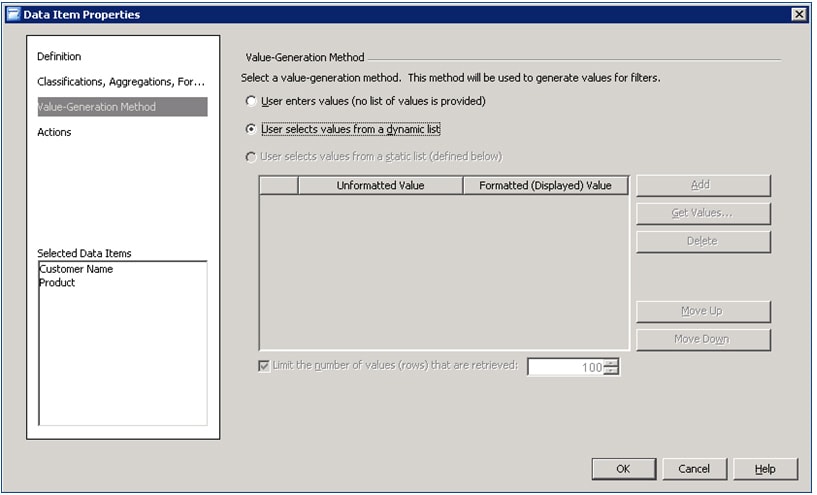
- In the Information Map Contents pane, press the CTRL key and select Customer Name and Product.
- In the Properties pane, click in the Value-generation method box to display the Value-Generation Method tab in the Data Item Properties dialog box.
- Select the User selects values from dynamic list option.
- Click OK to return to the main window.
| About the multi-edit feature
Because you are changing the same property for both data items, you can use the multi-edit feature, which is new in SAS Information Map Studio 4.2. Notice that both Customer Name and Product are listed in the Selected Data Items box in the Data Item Properties dialog box. |
Create a New Data Item
You will now create a new data item named Discount, so that your reports can include the discount percentage, if any, for each invoice.
- Select Insert ► New Data Item to open the Data Item Properties dialog box.
- On the Definition tab, enter
Discountas the name of the new data item. - Click Edit to open the Expression Editor dialog box and then create this expression:
(<<root.Prodlist>> - <<root.Invprice>>) / <<root.Invprice>>You can type the expression, or you can construct the expression by selecting data items from the Business Data list (or the Physical Data list) on the Data Sources tab and clicking Add to Expression to insert the selected data item into the Expression Text box.
- Click OK to return to the Data Item Properties dialog box.
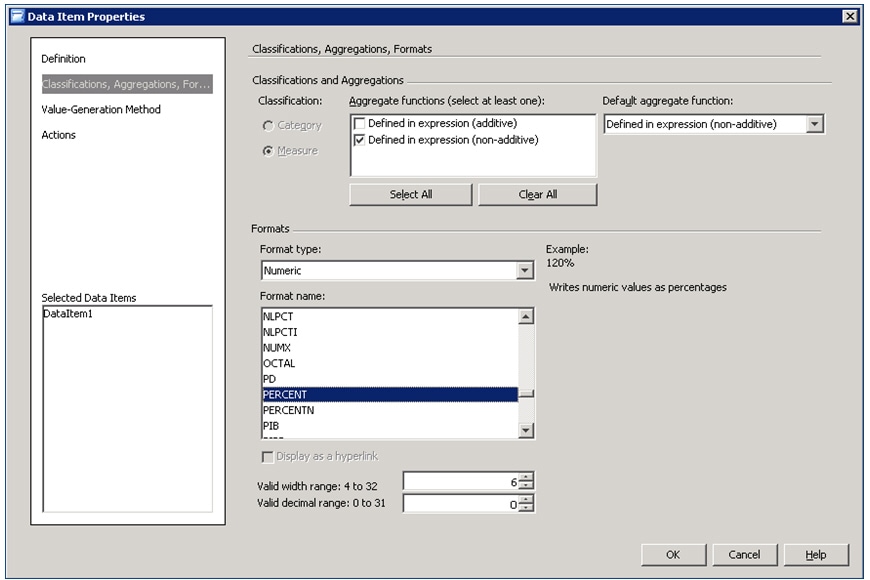
- Display the Classifications, Aggregations, Formats tab, and change these three settings. Accept the defaults for any settings that are not mentioned.
- For Aggregate functions, deselect Defined in expression (additive) and leave Defined in expression (non-additive) selected.
- For Format type, select Numeric.
- For Format name, select PERCENT with a width of 6.
- Click OK to finish creating your new data item, which is now listed along with the other data items in the Information Map Contents pane.
Note: The Physical Data list displays the data sources that are being used to create the information map. The Business Data list displays the data items contained in the information map. The Business Data list might include data items that only exist in the information map. For more information, see the SAS Information Map Studio Help.
The following screen capture shows Invoice Amount selected.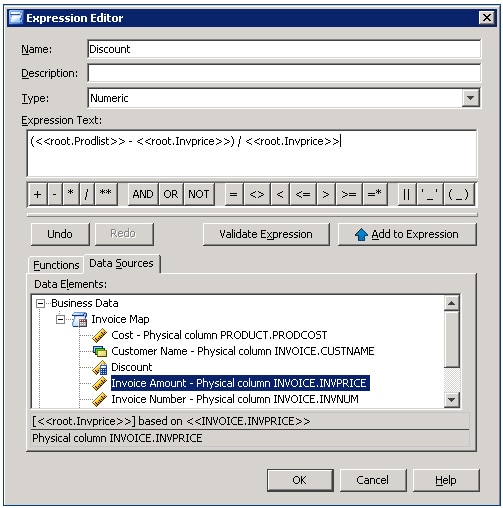
When you are done, your Classifications, Aggregations, Formats tab should look like this:
Create a Prompted Filter
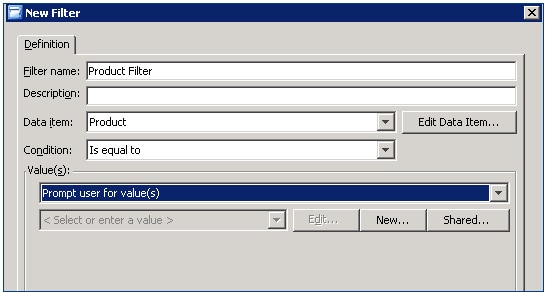
- Select Insert ► New Filter to open the New Filter dialog box, and then specify these settings:
- For Filter name, enter
Product Filter. - For Data item, select Product.
- For Value(s), select Prompt user for value(s).
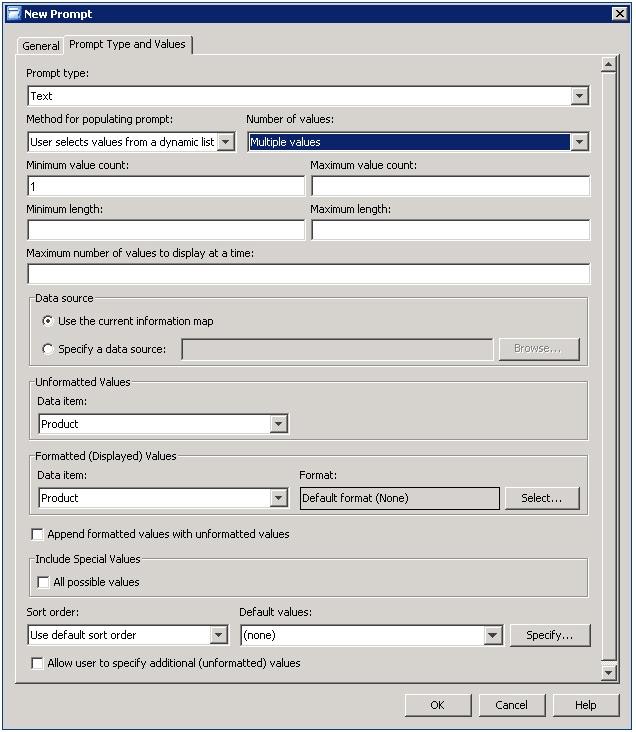
- Click New to open the New Prompt dialog box, and then specify these settings on the General tab. Accept the defaults for any settings that are not mentioned.
- For Name, enter
Prompt for Product. - For Displayed text, enter
Select one or more products to subset the query results. - Click the Prompt Type and Values tab and change these two settings. Accept the defaults for any settings that are not mentioned.
- For Method for populating prompt, select User selects values from a dynamic list.
- For Number of values, select Multiple values.
- Click OK to return to the New Filter dialog box.
- Click OK to finish creating the prompted filter for Product, which has been added to the Information Map Contents pane.
At this point, the New Filter dialog box should look like this:
The Prompt Type and Values tab should now look like this:
Test the Query
- Select Tools ► Run a Test Query to open the Test the Information Map dialog box.
Move all of the data items and the Product Filter into the Selected items list.
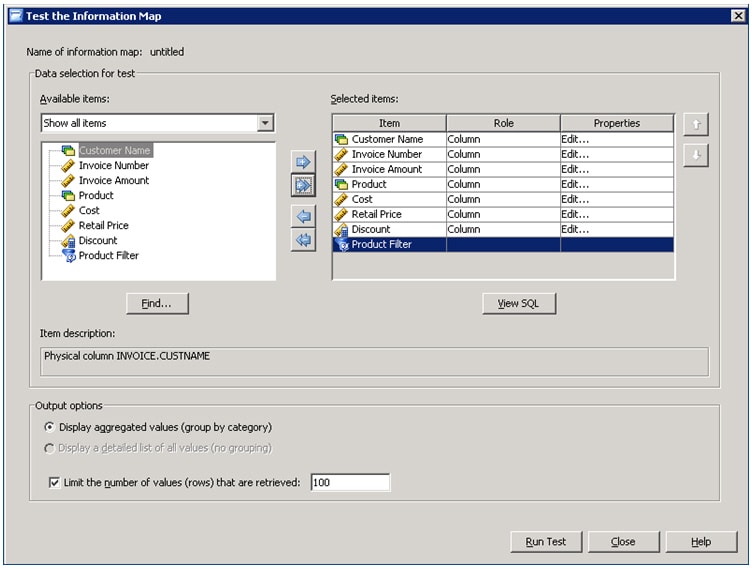
- Click Run Test.
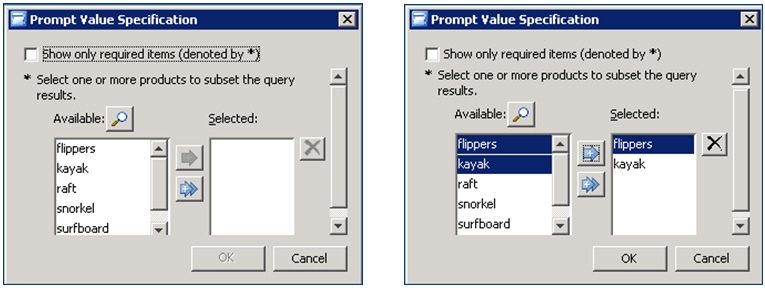
- Because the Product Filter is designed to prompt for values, a Prompt Value Specification dialog box appears. Select one or more of the products from the Available list and then click OK.
- Click Close, then Cancel, and then OK to exit all of the dialog boxes and return to the SAS Information Map Studio main window.
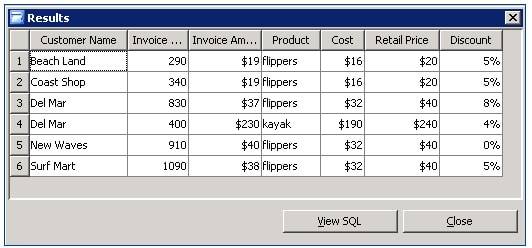
Here are the query results, which are subset to include just flippers and kayaks. Also notice that new Discount column shows which invoice amounts reflect a discount from the regular retail price.
Save the Information Map
- Select File ► Save to open the Save an Information Map dialog box. Navigate to the location where you want to save the map.
- For the Name, enter Invoice Map.
- Click Save to save the information map.
Tip: Your administrator might have a preferred location for where to store resources such as information maps.
You are now ready to use this information map in applications such as SAS® BI Dashboard and SAS® Web Report Studio.
Additional Resources
For more information about SAS Information Map Studio, see the SAS Information Map Studio documentation page.
These sample files and code examples are provided by SAS Institute Inc. "as is" without warranty of any kind, either express or implied, including but not limited to the implied warranties of merchantability and fitness for a particular purpose. Recipients acknowledge and agree that SAS Institute shall not be liable for any damages whatsoever arising out of their use of this material. In addition, SAS Institute will provide no support for the materials contained herein.