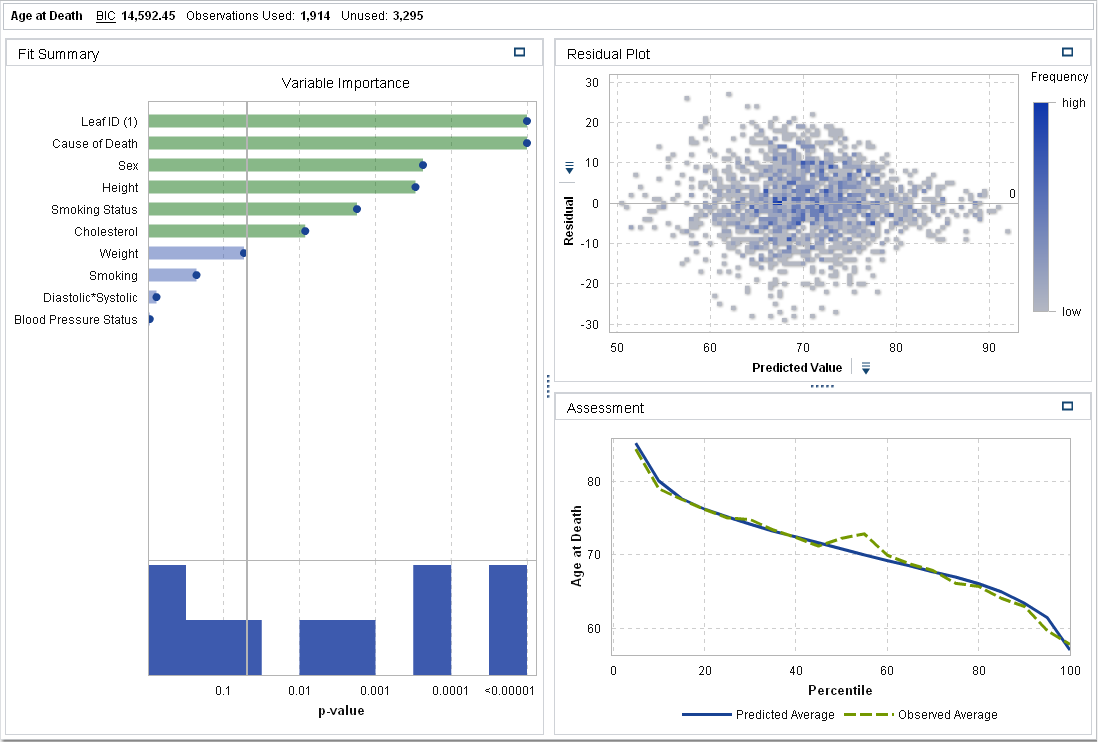
Create a Generalized Linear Model
From the toolbar, click the  icon next to the
  icon. Select Generalized Linear Model from the drop-down list. Minimize the Linear Regression visualization.
icon next to the icon. Select Generalized Linear Model from the drop-down list. Minimize the Linear Regression visualization.
From the Data pane, drag and drop the Age at Death variable into
the Response field in the right pane. In
the Data pane, hold down the Ctrl key, and
select Blood Pressure Status, Cause
of Death, Leaf ID (1), Sex, Smoking
Status, Cholesterol, Height, Smoking, Weight,
and Diastolic*Systolic. Drag and drop these
variables onto the model pane.

Click the Properties tab
in the right pane. The Distribution property enables you to specify the distribution of the response variable and to build a model based on that distribution. The default distribution is Normal.
To determine whether the normal distribution applies to the response variable, click
the  icon in the Data pane, and
select Measure Details. In the Measure
Details window, select Age at Death.
icon in the Data pane, and
select Measure Details. In the Measure
Details window, select Age at Death.
icon in the Data pane, and
select Measure Details. In the Measure
Details window, select Age at Death.
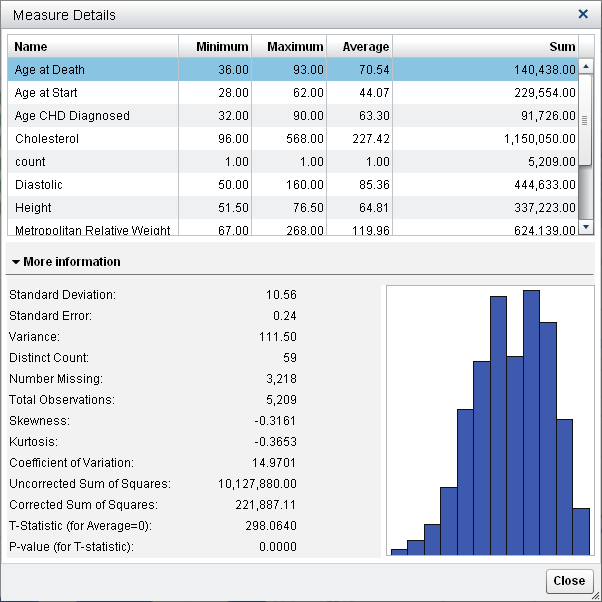
Notice that Age
at Death is not normally distributed and is slightly
skewed left. Click Close.
Although the distribution
is not exactly Poisson, use the Poisson distribution for this example.
For the Distribution property, select Poisson.
Next, select Identity for Link
function.
Note: You are encouraged to repeat
this example with different distributions and link functions and compare
their performance and to familiarize yourself with SAS Visual Statistics.
Save the project.
Copyright © SAS Institute Inc. All rights reserved.